Figures & data
Table 1 PCR Primer Sequences
Figure 1 RSL3 induced ferroptosis in HCC cells. (A) RSL3 induced HCC cell death in a dose-dependent manner, and cells with lower metastatic potentials (Huh7, HepG2) were more sensitive to RSL3. (B) Cell death induced by RSL3 could be reversed by Fer-1 but could not be reversed by ZVAD-FMK and necrostatin-1. ** p<0.01, *** p<0.001. (C) Images of HCC cells treated with RSL3 (1 μM) and DMSO (contrast) for 24 h observed by optical microscopy. (D) Transmission electron microscopy of HCCLM3 cells treated with RSL3 (1 μM, 6 h). (E) Representative images of HCCLM3 cells treated with 1 µM RSL3 for 6 h. Cells were fixed and stained after 6 h of RSL3 treatment. The images were captured using high-content screening microscopy. Orange, FerroOrange. Green, Liperfluo. Scale bar, 100 µm. (F). (G). Lipid ROS levels were analyzed by FCM in HCC cells with different metastatic potentials. (H). (I). Lipid ROS levels were analyzed by FCM in HCCLM3 cells treated with RSL3 (1 μM) ±Fer-1 (10 μM). ***p<0.001.
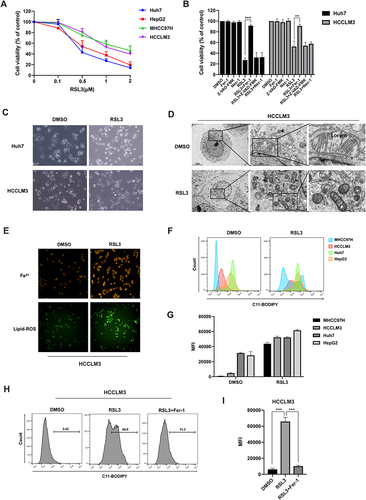
Figure 2 miR-612 enhances RSL3-induced ferroptosis in HCC cells. (A) Real-time PCR analysis of miR-612 expression in HCCLM3miR−612-OE and Huh7miR−612-KO cells. ** p<0.01. (B) The effects of miR-612 on HCC ferroptosis induced by RSL3 (1 μM, 24 h) analyzed by CCK8. * p<0.05, ** p<0.01. (C) Lipid ROS levels were increased in miR-612-OE cells, as analyzed by FCM. * p<0.05. (D) Fe2+ accumulation was observed by high-content screening microscopy.
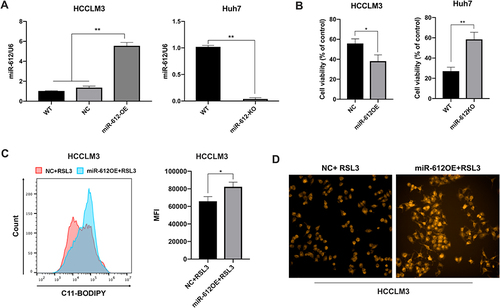
Figure 3 Effects of enhanced ferroptosis by miR-612 on HCC proliferation, migration and invasion. (A) Colony formation abilities and statistical results of RSL3-treated Huh7miR−612-KO and HCCLM3miR−612-OE cells. ** p<0.01, *** p<0.001. (B) Cell migration and invasion abilities and statistical results of Huh7miR−612-KO and HCCLM3miR−612-OE cells. Scale bars, 200 μm. *** p<0.001.
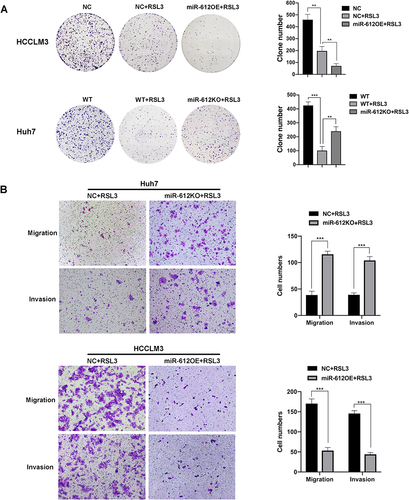
Figure 4 miR-612 regulates HCC ferroptosis via HADHA. (A), (B) Real-time PCR and Western blot analysis of HADHA mRNA and protein expression in HCCLMHADHA-KD and Huh7HADHA-OE cells. ** p<0.01. (C) The effects of HADHA on HCC ferroptosis induced by RSL3 (1 μM, 24 h) were analyzed by CCK-8 assay. * p<0.05, **p<0.01. (D) Lipid ROS levels were decreased in HADHA-OE cells and increased in HADHA-KD cells, as analyzed by FCM. *** p<0.001. (E) CCK-8 analysis of miR-612 on HCC ferroptosis induced by RSL3 (1 μM, 24 h) after HADHA rescue. * p<0.05, ** p<0.01. (F) FCM analysis of lipid ROS in miR-612 OE/KO cells after HADHA rescue. **p<0.01. *** p<0.001.
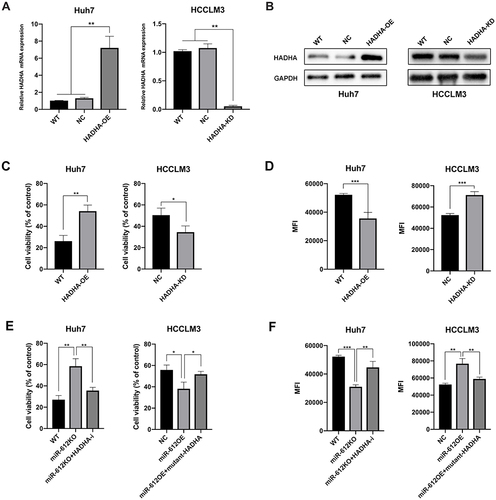
Figure 5 Effects of HADHA on the MVA pathway and HCC cell lipid metabolism. (A) Western blot analysis of the effects of HADHA on key enzymes in the MVA pathway. (B) HADHA upregulates CoQ10, as analyzed by mass spectrometry. *** p<0.001. (C) Heatmap showing that HADHA decreases the abundance of oxidized lipids after RSL3 induction. (D) Changes in lipid metabolites in HADHA-overexpressing cells.
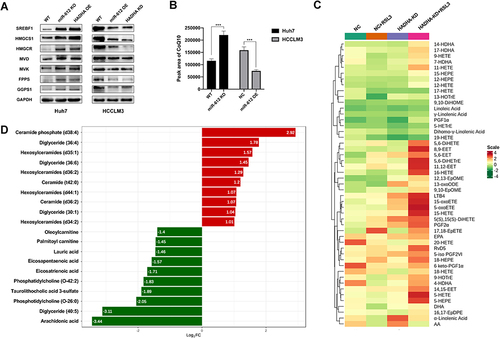
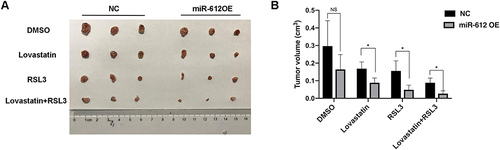
Figure 6 Effects of miR-612 on RSL3 and lovastatin in vivo. Macrograph (A) and absolute volume (B) of subcutaneous xenograft tumors in different groups. * p<0.05.