Figures & data
Figure 1 Flow chart showing the enrolled patients.
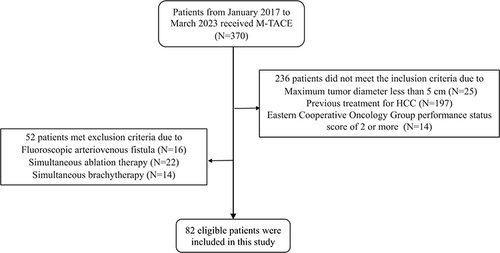
Figure 2 A 31-year-old male underwent M-TACE treatment. (A and B) The t1-weighted unenhanced magnetic resonance imaging (MRI) and t1-weighted enhanced MRI revealed a large enhancing tumor measuring 12.40 cm in the right lobe before M-TACE. (C and D) The hepatic angiography conducted before and after the M-TACE procedure revealed complete devascularization of the tumor’s tumor-feeding arteries. (E and F) Follow up t1-weighted unenhanced MRI and t1-weighted enhanced MRI at 1 month revealed complete response of the tumor.
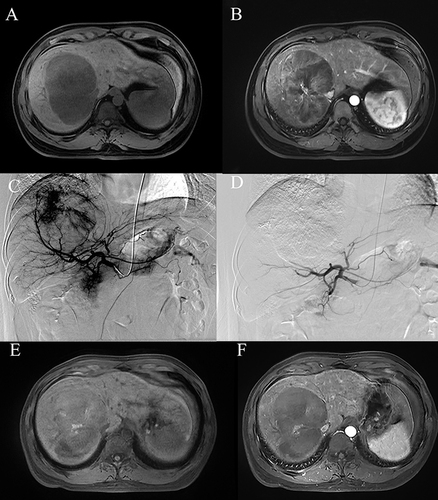
Figure 3 A 66-year-old female underwent M-TACE treatment. (A) The t1-weighted enhanced magnetic resonance imaging (MRI) revealed a large enhancing tumor measuring 7.07 cm in the right lobe before M-TACE. (B) During M-TACE, an enhanced cone-beam ct (CBCT) scan was performed through a microcatheter to identify the tumor supply artery using the following parameters: contrast flow rate of 1 mL/s, a total volume of 10 mL, and a delay of 4 s. (C) Non-enhanced CBCT was conducted five minutes after lipiodol injection to visualize the distribution of lipiodol.
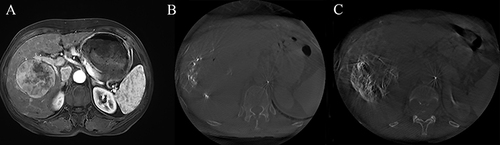
Table 1 Patient Demographic and Clinical Characteristics
Figure 4 Linear regression relationship between the maximum tumor size and the dosage of lipiodol (A) and microspheres (B).
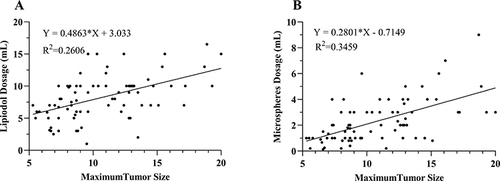
Table 2 Target Lesion Response of the 82 Patients 1 Month Following M-TACE
Table 3 Tumor Markers of the 82 Patients 1 Month Following M-TACE
Table 4 Subgroup Analysis of 1-Month Overall Response
Figure 5 Change in viable target lesion size after M-TACE. ***P<0.001.
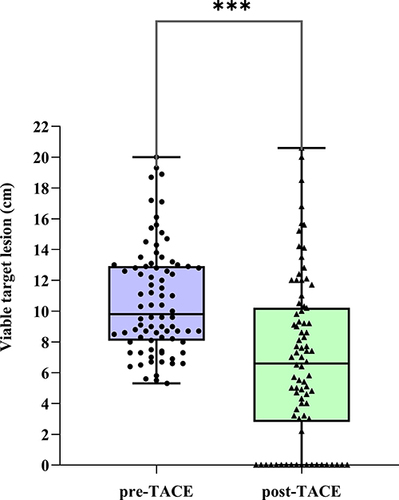
Figure 6 Kaplan-Meier curves of (A) progression-free survival (PFS) and (B) overall survival (OS) in patients with unresectable hepatocellular carcinoma (HCC) following M-TACE.
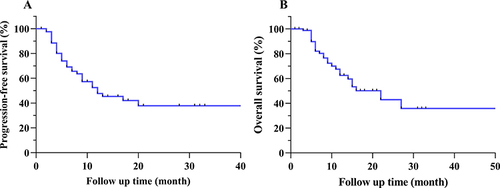
Table 5 Multivariate Cox Regression Analysis of Prognostic Factors for Overall Survival
Table 6 Adverse Events and Complications
Figure 7 (A–D) Changes in blood routine indexes before and after M-TACE. (E–H) Changes in liver function indexes before and after M-TACE. *P<0.05; ***P<0.001.
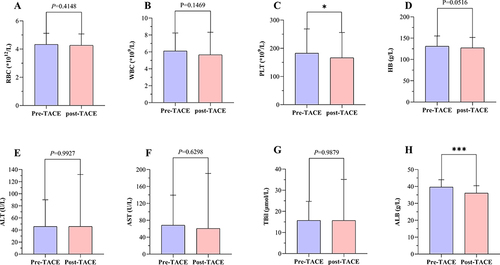
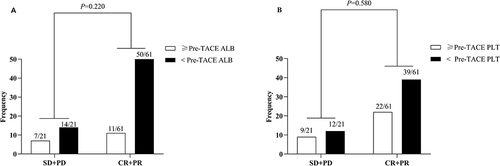
Figure 8 Subgroup analysis of the reduction in (A) albumin (ALB) and (B) platelets (PLT) levels and objective response rates after M-TACE.