Figures & data
Figure 1 Schematic diagram of the study design.
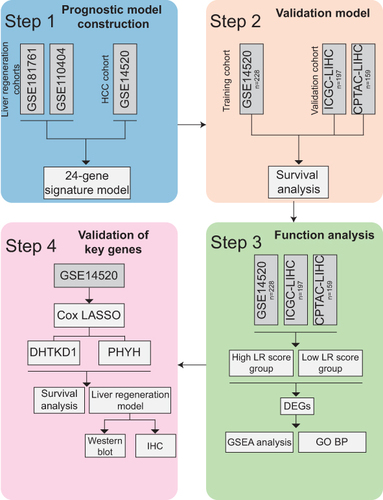
Figure 2 Identification of DELRGs and construction of LR scores. (A). Venn diagram shows the screening process of the 24 DELRGs. (B). Heat map of the expression of 24 DELRGs in GSE14520 dataset. (C). The correlation of 24 DELRGs in non-tumor tissues from the GSE14520 dataset is shown. (D). LR scores were validated in the GSE188421 dataset and presented as box plots.
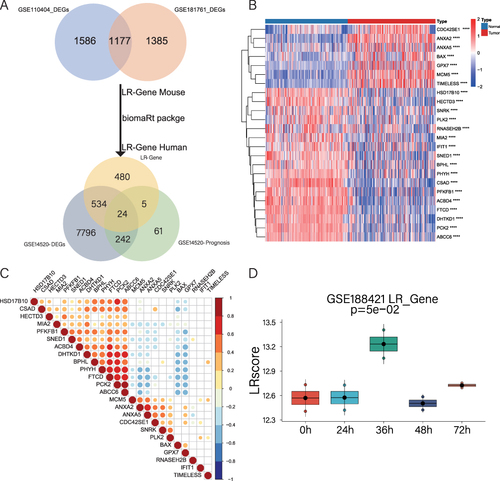
Table 1 Clinical Characteristics of HCC Patients in High and Low LR Scores in This Study
Figure 3 Establishment and validation of LR gene signature to predict clinical outcome for HCC patients. (A) Principal component analysis (PCA) based on LR score levels in non-tumor tissues in GSE14520, ICGC-LIHC and CPTAC-LIHC. (B and C) Distribution of patient survival status and survival time according to the LR score in non-tumor tissues in GSE14520, ICGC-LIHC and CPTAC-LIHC. (D) Overall survival curves in non-tumor tissues in GSE14520, ICGC-LIHC and CPTAC-LIHC.
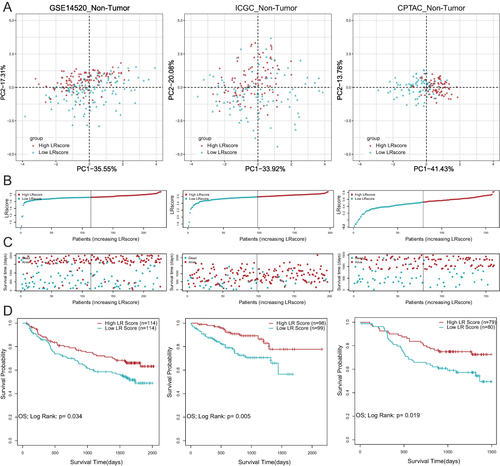
Figure 4 Functional analysis of DEGs between high and low LR score groups in non-tumor tissues. (A). Seven representative GO pathways were enriched in the high LR score group by GSEA analysis. (B). Eight representative upregulated KEGG pathways in the high LR score group by GSEA analysis. (C). GO BP enrichment analysis was performed for upregulated DEGs between high and low LR score groups. (D). The ssGSEA scores of the three categories of tissues in the four KEGG representative pathways are presented as violin plots.
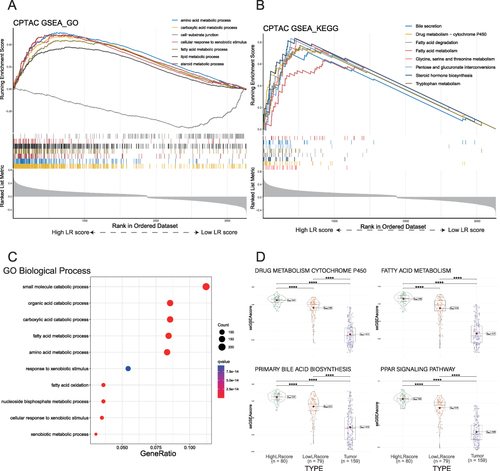
Figure 5 DHTKD1 and PHYH play important roles in the prognosis of non-tumor tissues. (A). Heat map of the expression of 24 DELRGs in the high and low LR score group in non-tumor tissues of the GSE14520 dataset. (B and C). 2 signature LR genes were selected by LASSO Cox regression analysis. (D). Higher expression of DHTKD1 and PHYH has better prognosis in non-tumor tissues of the GSE14520 dataset.
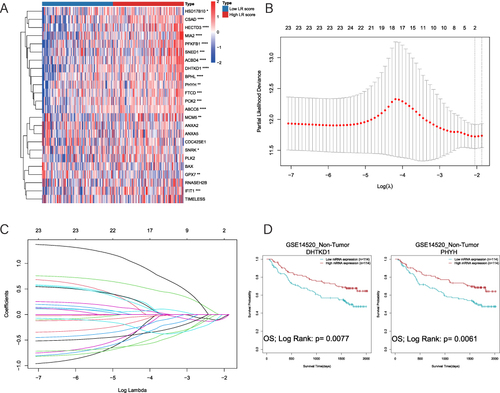
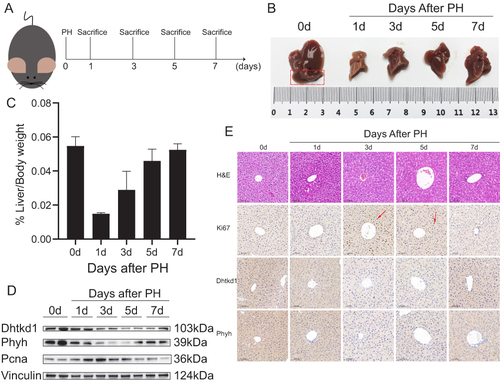
Figure 6 Validation of DHTKD1 and PHYH in experimental model of liver regeneration. (A). Schematic illustration of the experimental design of the mouse model. (B). Mouse livers on days 0, 1, 3, 5, and 7 after PH showed differences in liver size at different time points in liver regeneration. (C). Liver/Body weight ratio at different time points. (D). The expression of DHTKD1 and PHYH in liver tissue at different time points after PH was detected by Western blot. (E). H&E staining, Ki-67 staining of mouse livers after PH and the validation of DHTKD1 and PHYH expression. Scale bar: 0.100 mm.