Figures & data
Table 1 Clinical Characteristics
Figure 1 The flowchart shows the inclusion and exclusion of subjects.
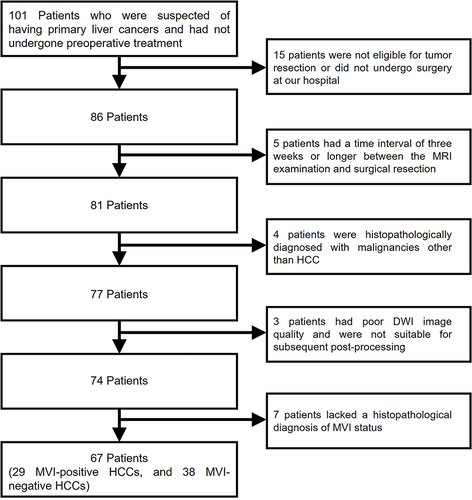
Figure 2 Representative MRI images including the T2WI, T1WI, DWI of b = 100 s/mm2 and bi-IVIM-derived parametric maps (fp, Dt and Dp) as well as tri-IVIM-derived parametric maps (fs, ff, fvf, Ds, Df and Dvf) of a patient with MVI-negative HCC.
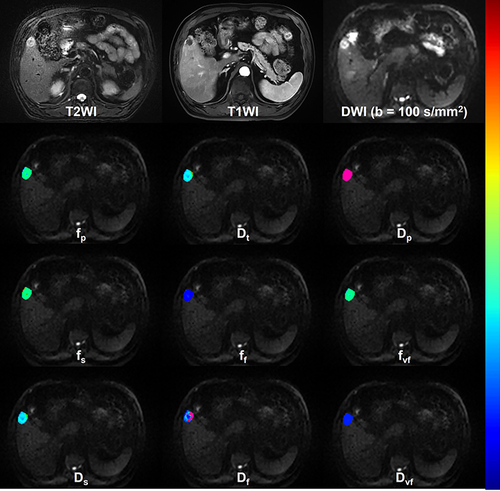
Figure 3 Representative MRI images including the T2WI, T1WI, DWI of b = 100 s/mm2 and bi-IVIM-derived parametric maps (fp, Dt and Dp) as well as tri-IVIM-derived parametric maps (fs, ff, fvf, Ds, Df and Dvf) of a patient with MVI-positive HCC.
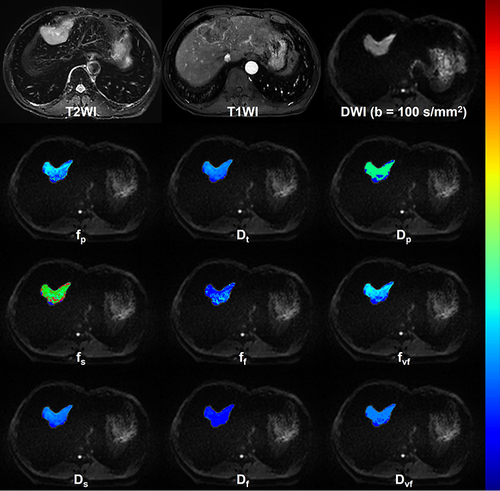
Figure 4 Quantitative comparison of bi-IVIM and tri-IVIM derived metrics between MVI-negative and MVI-positive HCCs.
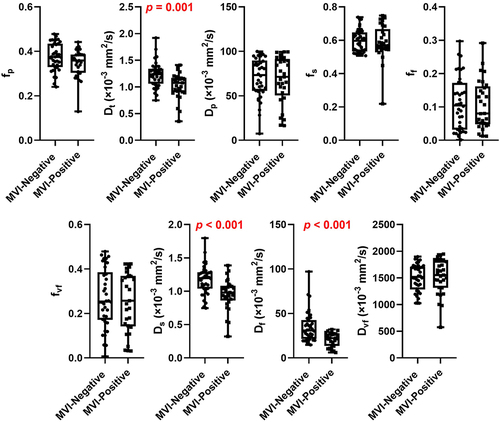
Figure 5 The receiver characteristics curves (ROC) of Df, Ds, Dt and the combination of Df and Ds (Df+Ds).
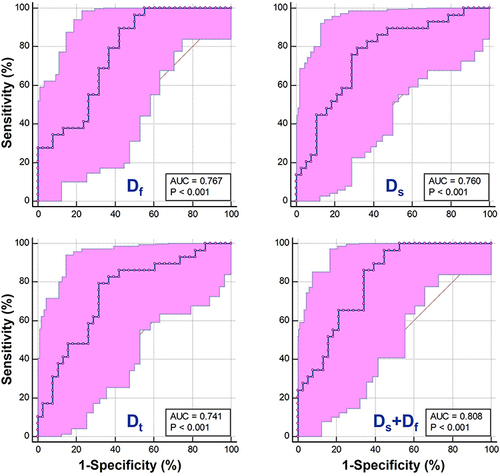
Table 2 Explore the Independent Risk Factors of MVI Through Univariable and Multivariable Logistic Regression Analysis
Figure 6 Evaluation of the nomogram-based model.
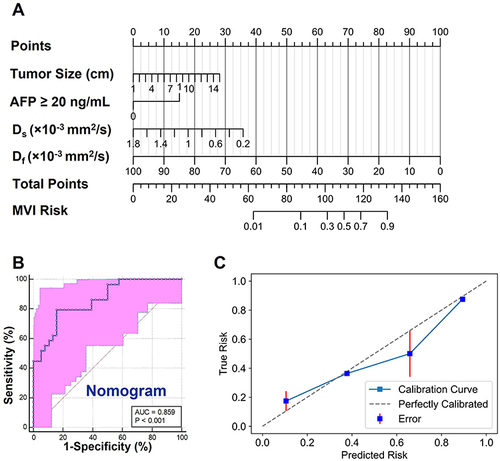
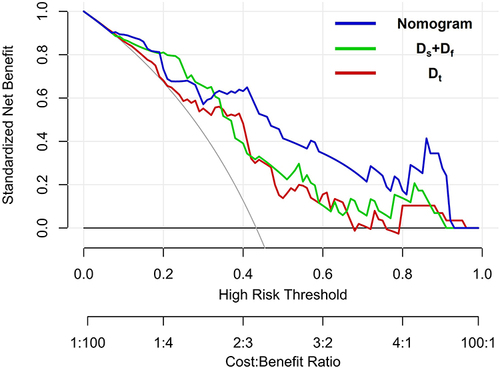
Figure 7 The decision curve of the nomogram-based model, tri-IVIM (Ds+Df) and bi-IVIM (Dt).