Figures & data
Figure 1 Detailed flowchart from DCE-MRI scanning to nomogram model development.
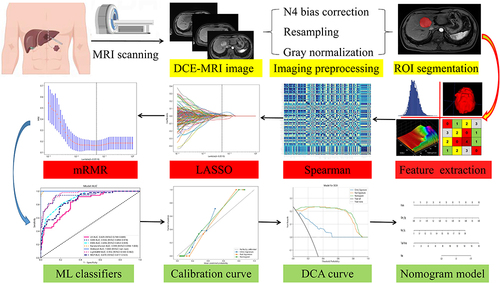
Table 1 Baseline Characteristics of Included Patients Diagnosed with HCC
Figure 2 The distribution plot of retained radiomics signatures after Spearman rank correlation (A). Using the LASSO method with tenfold cross-validation based on the minimum binomial deviation, the most valuable signatures with nonzero coefficients were identified (B). At lambda (λ) = 0.0391, eighteen signatures identified by mRMR method were demonstrated (C). The weighted importance of the selected eighteen signatures (D).
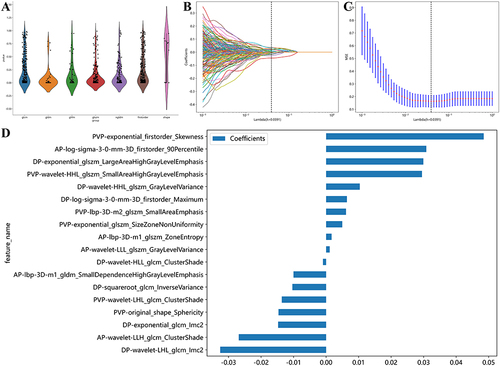
Table 2 Various Machine Learning Classifiers for Diagnosing pHCC
Figure 3 The ROC curve of eight machine learning classifiers in diagnosing HCC differentiation in the training (A) and validation (B) cohorts. The confusion matrix (C) and sample prediction histogram (D) of XGBoost classifier in evaluating HCC differentiation.
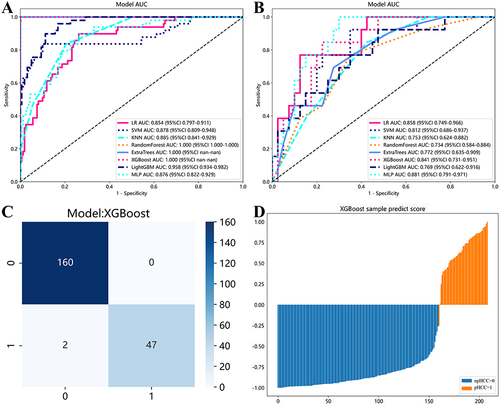
Table 3 MRI Features of Each HCC Nodule
Figure 4 The ROC curve, calibration curve, and DCA curve of three models in evaluating HCC differentiation in the training (A–C) and validation (D–F) cohorts, respectively. The radiomics model presented higher diagnostic accuracy, better goodness-of-fit and improved net clinical benefits in the training cohort.
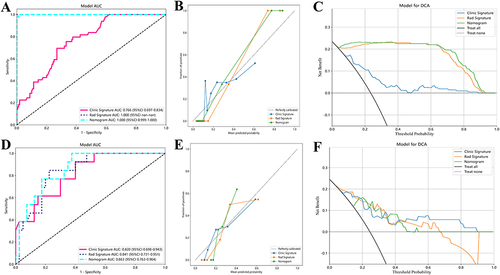
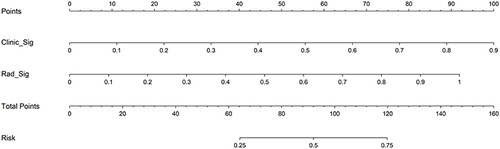
Figure 5 The nomogram model for diagnosing HCC differentiation.