
Figures & data
Figure 1 Flowchart of enrolled patients.
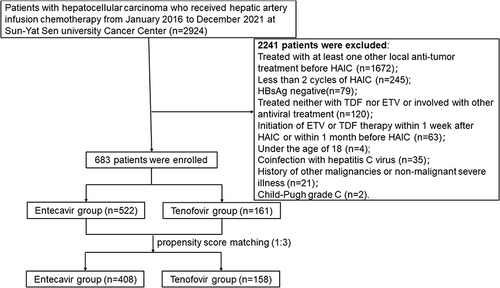
Table 1 Baseline Characteristics of Patients Before PSM (n=683) and After PSM (n=566)
Figure 2 Kaplan‒Meier curves of overall survival after HAIC between the two groups in the full cohort (A) and in the matched cohort (B), after HAIC with < 4 cycles between the two groups in the full cohort (C) and in the matched cohort (D), and after HAIC with ≥ 4 cycles between the two groups in the full cohort (E) and in the matched cohort (F).
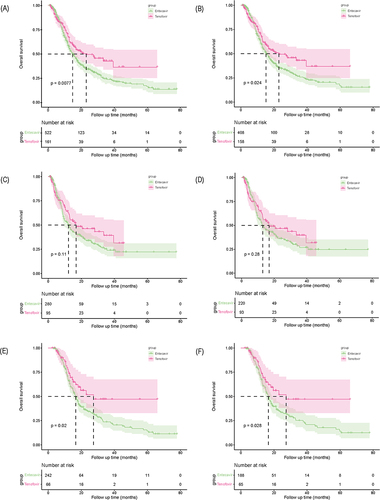
Figure 3 Kaplan‒Meier curves of progression-free survival after HAIC between the two groups in the full cohort (A) and in the matched cohort (B), after HAIC with < 4 cycles between the two groups in the full cohort (C) and in the matched cohort (D), and after HAIC with ≥ 4 cycles between the two groups in the full cohort (E) and in the matched cohort (F).
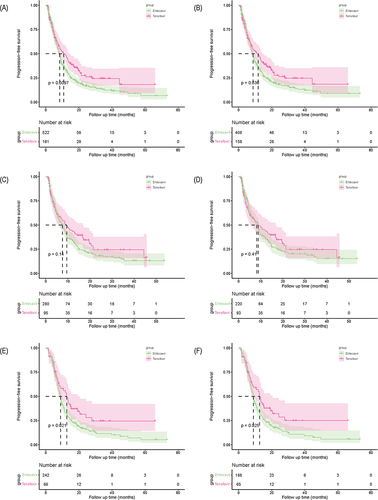
Table 2 Univariate and Multivariate Analyses of Prognostic Factors for Overall Survival and Progression-Free Survival
Table 3 HBV Reactivation During HAIC and the ALBI Grade Remained Stable or Improved After HAIC in the Two Groups in the Matched Cohort
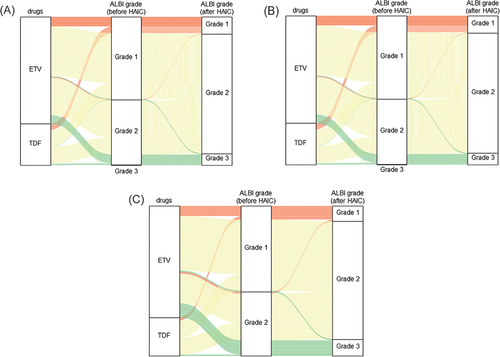
Figure 4 Sankey diagram of ALBI grade change after HAIC in the matched cohort of all patients (A), of patients with < 4 cycles of HAIC (B), and of patients with ≥ 4 cycles of HAIC (C).
Data Sharing Statement
All data generated and/or analyzed during the current study are available from the corresponding author upon reasonable request.