
Figures & data
Figure 1 Flow diagram of the patient characterization process.
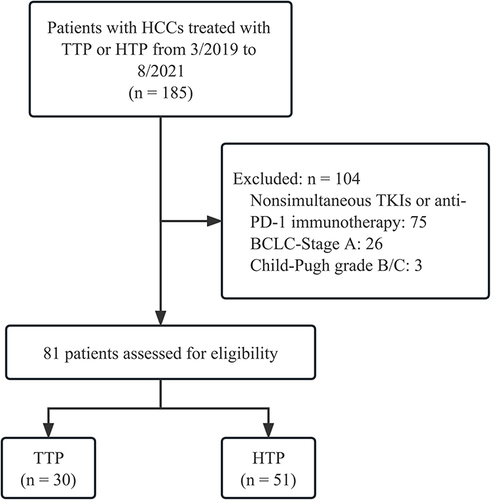
Table 1 Baseline Characteristics
Figure 2 Kaplan–Meier curves of overall survival and progression-free survival. (A) Overall survival. (B) Progression-free survival. (C) Overall survival after propensity score matching. (D) Progression-free survival after propensity score matching.
Abbreviations: TTP, transarterial chemoembolization plus tyrosine kinase inhibitors and anti-programmed cell-death-protein-1 agent; HTP, hepatic infusion chemotherapy plus tyrosine kinase inhibitors and anti-programmed cell-death-protein-1 agent.
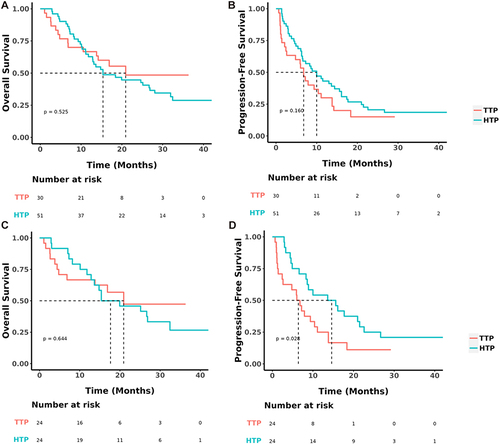
Figure 3 Forest plot for survival outcomes.
Abbreviations: TTP, transarterial chemoembolization plus tyrosine kinase inhibitors and anti-programmed cell-death-protein-1 agent; HTP, hepatic infusion chemotherapy plus tyrosine kinase inhibitors and anti-programmed cell-death-protein-1 agent.
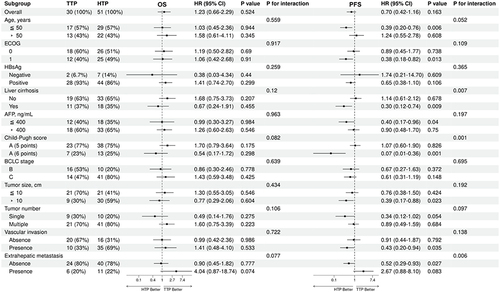
Table 2 Summary of Best Response
Table 3 Univariate and Multivariate Analysis of Risk Factors for Overall Survival and Progression-Free Survival