Figures & data
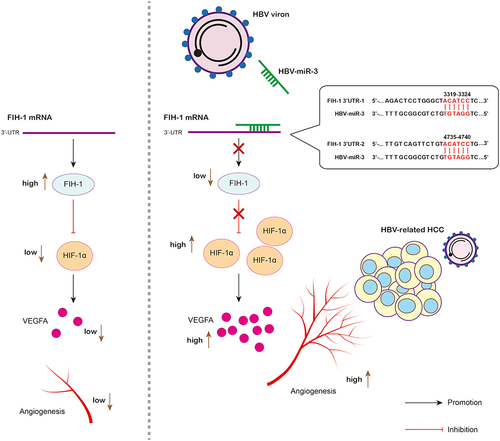
Table 1 Clinical Characteristics of HBV-miR-3 High and Low HCC Patients in Cohort
Figure 1 High HBV-miR-3 expression is associated with poor prognosis of HBV-related HCC patients and HCC angiogenesis. (A) HBV-miR-3 levels in HBsAg(-)HBcAb(+) patients (n=23) and HBsAg(+)HBcAb(+) patients (n=108). (B) Kaplan–Meier survival curves according to HBV-miR-3 expression in the tissue of HBV-related HCC patients (classified as low or high using the median value of all patients normalized to patient 1). Survival curves of two groups were compared using the Log rank test. (C) Pearson Correlation analysis of HBV-miR-3 and VEGFR2 gene expression.
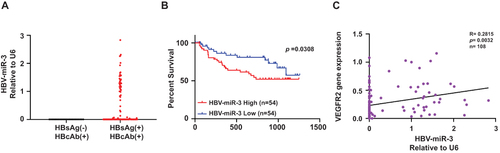
Figure 2 HBV-miR-3 can be detected in HBV infected HCC cell line and negatively correlated with FIH-1. (A) HBV-miR-3 levels in HepG2 and HepG2.2.15 cells. (B) HIF-1α, VEGFA and FIH-1 protein expressions in HepG2 and HepG2.2.15 cells. (C) Predicted HBV-miR-3 binding sites in the 3’-UTR of FIH-1 mRNA. (D) Pearson Correlation analysis of HBV-miR-3 and FIH-1 protein expression in HBV-related HCC patients. The error bars represent the SD from at least three independent biological replicates.
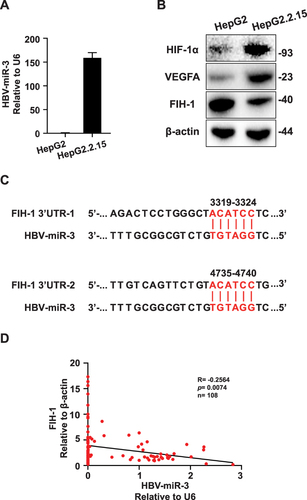
Figure 3 HBV-miR-3 promotes VEGFA secretion from HCC cells by regulating FIH-1/HIF-1α/VEGFA signaling. (A–C) Gene expression of FIH-1, HIF-1α and VEGFA in HepG2 cells after been transfected with different concentration of HBV-miR-3 agomir and negative control. (D) Western blot analysis of FIH-1, HIF-1α and VEGFA protein expression of HepG2 cells after been transfected with different concentration of HBV-miR-3 agomir. (E) ELISA analysis of VEGFA levels of supernatant of HepG2 cells transfected with different concentration of HBV-miR-3 agomir and negative control. (F) Schematic of lumen formation assay. Culture supernatants were collected from HBV-miR-3 agomir transfected HepG2 cells at 48 h. HUVEC were treated with the supernatants from HepG2 for 6h. (G) Representative pictures of lumen formation assay. Scale bar=200 μm. (H) Junction numbers of HUVEC of lumen formation assay. (n=3). (I) Total lumen lengths of HUVEC for lumen formation assay. (n=3). The error bars represent the SD from at least three independent biological replicates. ANOVA was used to calculate p values, represented as * p< 0.05; ** p < 0.01; *** p < 0.001; **** p < 0.0001; n.s, not significant.
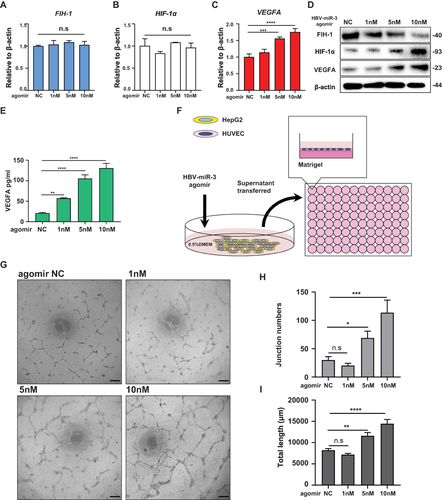
Figure 4 Downregulating HBV-miR-3 induces FIH-1 protein expression. (A–C) Gene expression of FIH-1, HIF-1α and VEGFA in HepG2.2.15 cells after been transfected with different concentration of HBV-miR-3 antagomir and negative control. (D) Western blot analysis of FIH-1, HIF-1α and VEGFA protein expression of HepG2.2.15 cells after been treated with different concentration of HBV-miR-3 antagomir. (E) ELISA analysis of VEGFA levels of supernatant of HepG2 cells treated with different concentration of HBV-miR-3 antagomir and negative control. (F) Schematic of the lumen formation assay. Culture supernatants were collected from HBV-miR-3 antagomir transfected HepG2.2.15 cells at 48 h. HUVEC were treated with the supernatants from HepG2.2.15 for 6h. (G) Representative pictures of lumen formation assay. Scale bar=200 μm. (H) Junction numbers of HUVEC of lumen formation assay. (n=3). (I) Total lumen lengths of HUVEC of lumen formation assay. (n=3). The error bars represent the SD from at least three independent biological replicates. ANOVA was used to calculate p values, represented as ** p < 0.01; *** p < 0.001; **** p < 0.0001; n.s, not significant.
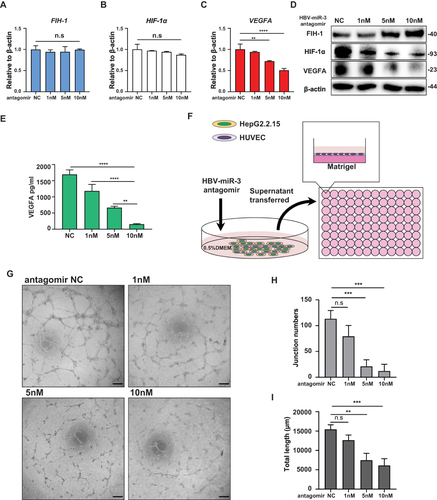
Figure 5 HBV-miR-3 induces HCC angiogenesis and inhibiting HBV-miR-3 reduces HCC angiogenesis in vivo. (A–C) Effect of HBV-miR-3 on the growth of HepG2 xenografts. Mice were sacrificed after being injected with 5nmol HBV-miR-3 agomir or agomir NC twice a week for 12 days. (D, E and F) Effect of inhibiting HBV-miR-3 on the growth of HepG2.2.15 xenografts. Mice were sacrificed after being injected with 15μg HBV-miR-3 antagomir or antagomir NC twice a week for 16 days. (G and H) Western blot analysis of FIH-1, HIF-1α, VEGFA and VEGFR2 expression in xenograft tumors derived from HepG2 cells. β-Actin was used as the reference for quantifying protein expression. (I) Representative IHC staining images of FIH-1, HIF-1α and VEGFR2 expression in HepG2 cell xenografts. Scare bars=100μm. (J and K) Western blot analysis of FIH-1, HIF-1α, VEGFA and VEGFR2 expression in xenograft tumors derived from HepG2.2.15 cells. β-Actin was used as the reference for quantifying protein expression. (L) Representative IHC staining images of FIH-1, HIF-1α and VEGFR2 expression in HepG2 cell xenografts. Scare bars=100μm. The error bars represent the SD from at least three independent biological replicates. Student’s t-test was used to calculate p values, represented as * p < 0.05; ** p < 0.01, *** p < 0.001; **** p < 0.0001.
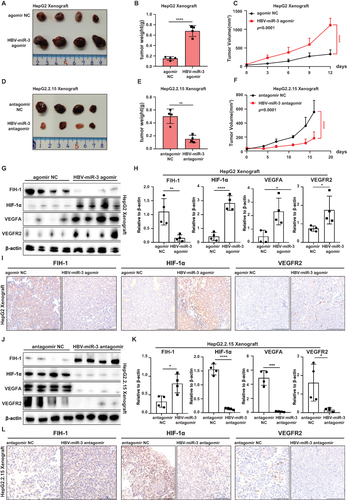
Figure 6 HBV-miR-3 inhibits FIH-1 protein expression by targeting 3’-UTR of FIH-1 mRNA. (A) Mutant sequences of HBV-miR-3. (B) Western blot analysis of FIH-1, HIF-1α and VEGFA protein expression of HepG2 cells after been transfected with HBV-miR-3 agomir control, 10nM agomir and mutant agomir. (C) ELISA analysis of VEGFA levels of supernatant of HepG2 cells transfected with HBV-miR-3 agomir, HBV-miR-3 agomir_Mut and negative control. (D) Representative pictures of lumen formation assay. Scale bar=200 μm. (E) Junction numbers of HUVEC of lumen formation assay. (n=3). (F) Total lumen lengths of HUVEC for lumen formation assay. (n=3). (G) Wild-type and mutant fragments of the 3ʹ-UTR of FIH-1 mRNA. (H and I) Luciferase activity of HepG2 cells transfected with HBV-miR-3 agomir and the wild-type or mutant fragment of the 3ʹ-UTR of FIH-1 mRNA. (J) Luciferase activity of HepG2.2.15 cells co-transfected with HBV-miR-3 antagomir and the wild-type of the 3ʹ-UTR of FIH-1. The error bars represent the SD from at least three independent biological replicates. Student’s t-test was used to calculate p values, represented as * p< 0.05; ** p < 0.01; *** p < 0.001; **** p < 0.0001. The error bars represent the SD from at least three independent biological replicates. ANOVA was used to calculate p values, represented as * p< 0.05; ** p < 0.01; n.s, not significant.
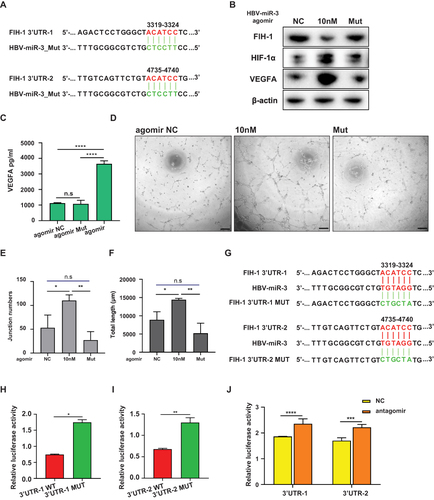
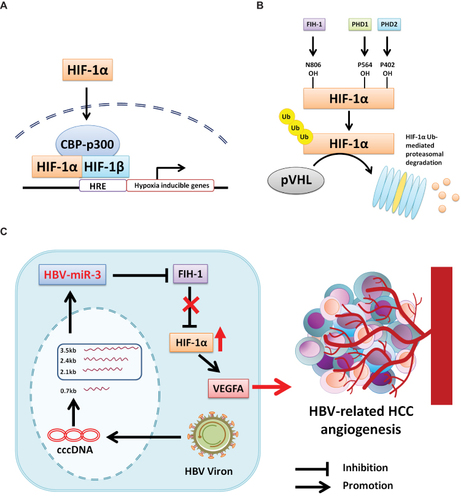
Figure 7 HBV-miR-3 promotes HBV-related HCC by targeting 3’UTR of FIH-1 mRNA. (A) Under hypoxia condition, HIF-1α keeps stabilization and transferring into nucleus, forming HIF-1α/HIF-1β/CBP-p300 complex, interacting with HRE and triggering hypoxia inducible genes. (B) Under normoxia condition, HIF-1α was hydroxylated by FIH-1, PHD1 and PHD2, then binding with pVHL and degraded by proteasome. (C) HBV-miR-3 is generated from 3.5-kb, 2.4-kb, and 2.1-kb transcripts of cccDNA. HBV-miR-3 inhibits FIH-1 expression, leading to the up-regulation of HIF-1α and VEGFA to promote angiogenesis in HCC.