Figures & data
Table 1 Baseline Characteristics for the Training and Validation Cohorts of HCC Patients Who Underwent HAIC
Figure 1 SIS is associated with OS in patients with hepatocellular carcinoma. (a and b) Univariate Cox regression analysis (a) and multivariate Cox regression analysis (b) between blood indicators and overall survival in the training cohort. The indicators with statistical significance (p < 0.05) are presented in bold text. (c) The calculation formula of SIS. (d and e) Kaplan–Meier estimates of overall survival in the training cohort (d) and the validation cohort (e) of patients in the low- and high- SIS groups.
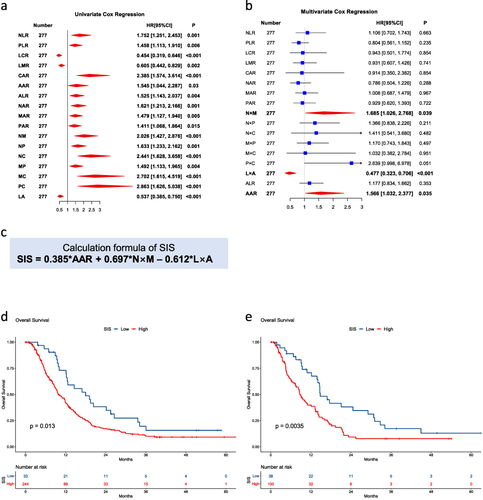
Table 2 Cox Regression Analysis for OS Among Clinical Characteristics and SIS in the Training Cohort
Table 3 Relationship Between SIS and Clinical Characteristics
Figure 2 Nomogram depicting 2- and 3-year overall survival probability for patients with hepatocellular carcinoma.
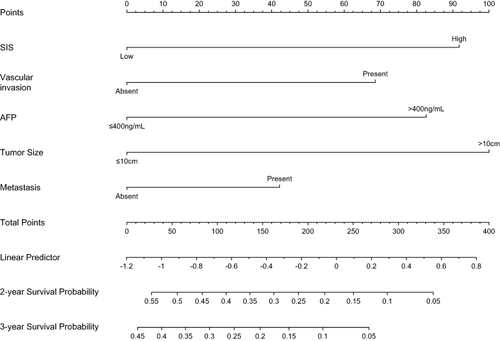
Figure 3 Calibration plots of overall survival in the training and validation cohorts. (a and b) Calibration plot of the nomogram for 2-year survival in the training cohort (a) and validation cohort (b). (c and d) Calibration plot of the nomogram for 3-year survival in the training cohort (c) and validation cohort (d).
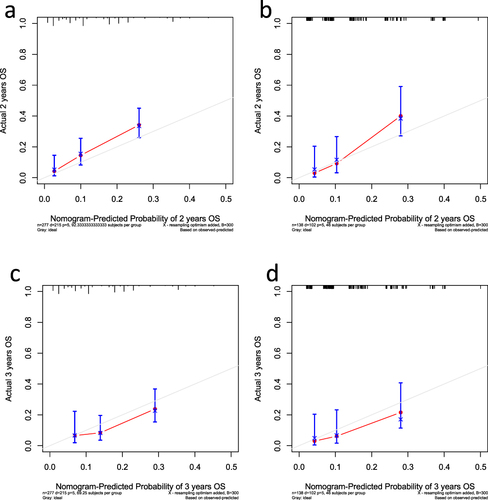
Figure 4 Nomogram has better predict ability than other prognostic factors. (a and b) ROC analysis of 2- and 3-year overall survival for nomogram in the training cohort (a) and validation cohort (b). (c and d) AUC of ROC curves compared the prognostic accuracy for 2-year survival of the nomogram and other prognostic factors in the training cohort (c) and validation cohort (d). (e and f) AUC of ROC curves compared the prognostic accuracy for 3-year survival of the nomogram and other prognostic factors in the training cohort (e) and validation cohort (f).
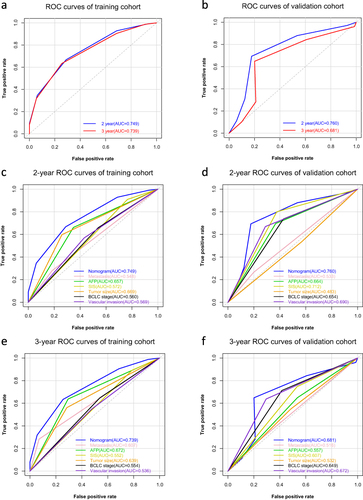
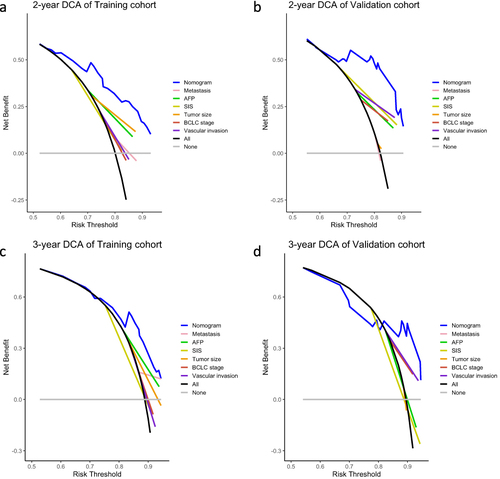
Figure 5 Decision-curve analysis (DCA) of nomogram in the training and validation cohorts. (a and b) DCA curves compared the standardized net benefit for 2-year survival of the nomogram and other prognostic factors in the training cohort (a) and validation cohort (b). (c and d) DCA curves compared the standardized net benefit for 3-year survival of the nomogram and other prognostic factors in the training cohort (c) and validation cohort (d).