Figures & data
Figure 1 Flowchart of the study. (A) Selection process for participants in the study, (B) The development and evaluation of the nomogram.
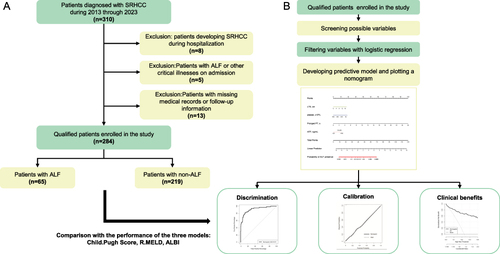
Table 1 Baseline Characteristics of the Enrolled Patients
Table 2 Univariate Logistic Regression Analysis of ALF Presence Based on Variables Possible
Table 3 Multivariate Logistic Regression Analysis of ALF Presence Based on Variables Possible
Figure 2 Linear correlation analysis of the four indicators (LTS, platelet, pronged PT, and AFP). The number in the right of the plot was the correlation coefficient.
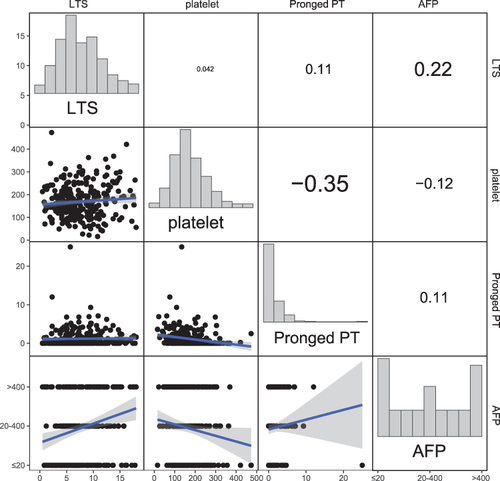
Figure 3 Nomogram for preoperative estimation of acute liver failure risk.
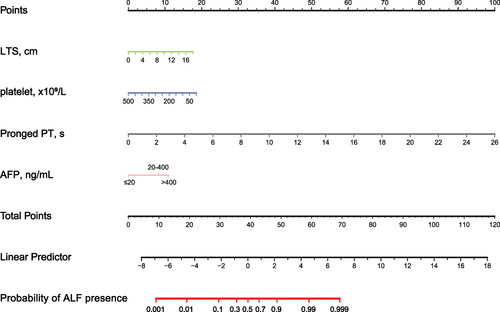
Figure 4 Comparison of receiver operating characteristic curve (A), calibration curve (B) and decision curve analysis (C) between diagnostic nomogram and each independent predictor.
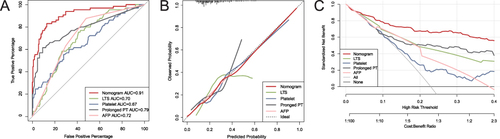
Table 4 Accuracy of the Prediction Score of the Nomogram for Estimating the Risk of ALF Presence Compared with Other Models
Figure 5 The receiver operating characteristic curve of each model. (A) Nomogram. (B) Child.Pugh. (C) R.MELD. (D) ALBI.
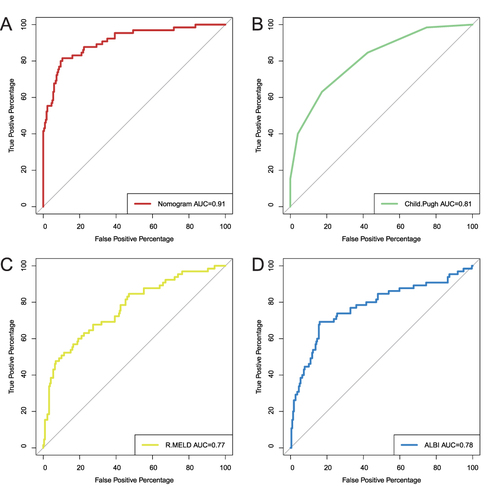
Figure 6 The calibration curve of each model. (A) Nomogram. (B) Child.Pugh. (C) R.MELD. (D) ALBI.
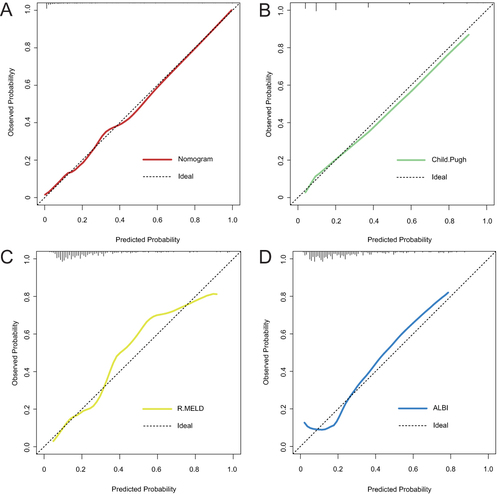
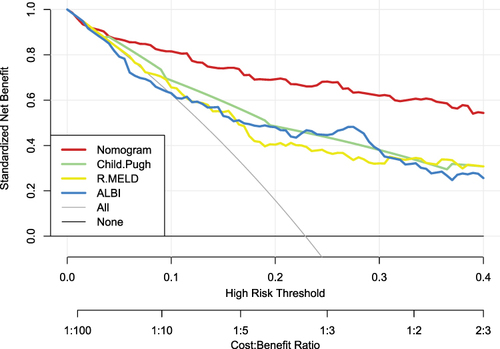
Figure 7 The comparison of decision curve analysis for each model.