Figures & data
Figure 1 Study flowchart. Patients with proliferative hepatocellular carcinoma who underwent liver resection in institution (A) (n=203) were included in the training cohort for establishing the predictive model. Patients from institutions (B and C) (n=56) were included in the external validation cohort.
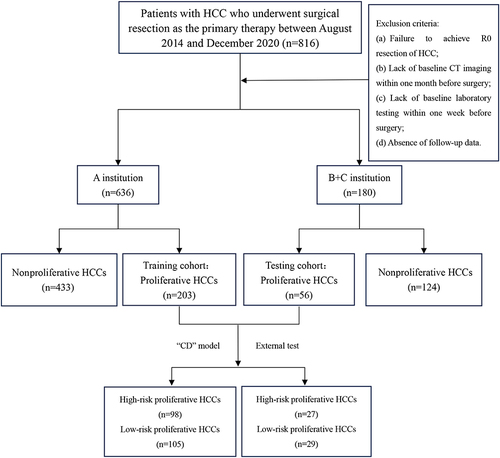
Table 1 The Demographic, Radiological and Laboratorial Characteristics of Patients in Training Cohort and Validation Cohort
Figure 2 (A) Images showing a case of proliferative hepatocellular carcinoma in the 7th segment of the liver of a 50-year-old man with cirrhosis. The lesion was 41 mm in size, with an oval shape, and without satellite nodules on the CT images. CT image during the arterial phase displayed heterogenous enhancement. A washout appearance was observed in the delayed phase of the CT scan. These observations qualified as Liver Imaging Reporting and Data System category 5. Microscopic examination with hematoxylin and eosin staining confirmed the presence of the macrotrabecular-massive HCC subtype. (B) Images illustrating a case of nonproliferative hepatocellular carcinoma at the junction of the 7th and 8th segments of the liver of a 48-year-old woman without cirrhosis. The lesion was 22 mm in size, with a round shape, and without satellite nodules on the CT images. CT image during the arterial phase CT image showed moderate enhancement, while a washout appearance was noted during the delayed phase. These observations qualified as Liver Imaging Reporting and Data System category 5. Microscopic examination with hematoxylin and eosin staining confirmed the presence of the clear cell HCC subtype.
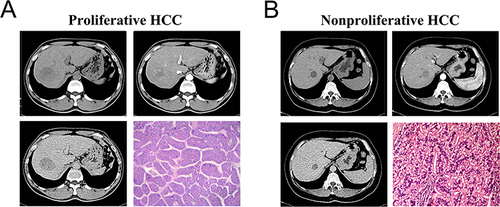
Table 2 The Baseline Characteristics of Proliferative and Nonproliferative HCC Before PSM in the Entire Population
Table 3 The Baseline Characteristics of Proliferative and Nonproliferative HCC After PSM in the Entire Population
Figure 3 Disease-free survival curves of proliferative and nonproliferative HCC before (A) and after (B) propensity score matching in the entire cohort.
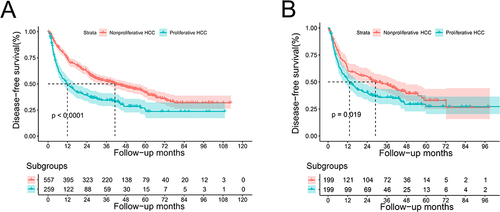
Table 4 Assessment of Potential Risk Factors for Postoperative Prognosis of Proliferative HCC in Training Cohort
Figure 4 (A) Nomogram for predicting the probability of disease-free survival at 1, 3, and 5 years. Each predictor corresponds to a specific point by drawing a line straight upward to the points axis. The sum of the points is located on the total points axis, and this sum represents the probability of disease-free survival. (B) ROC curves in the training cohort. (C) ROC curves in the validation cohort.
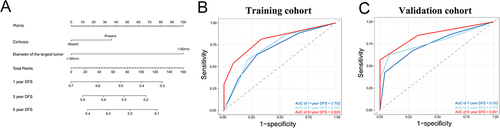
Figure 5 Disease-free survival curves for the total cohort (A), training cohort (B), and validation cohort (C).
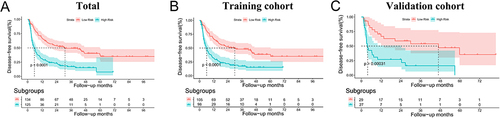
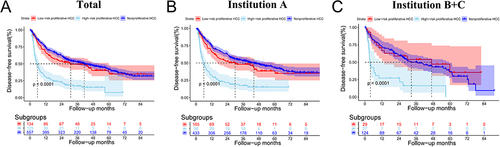
Figure 6 Survival curves of the nonproliferative, high-risk proliferative, and low-risk proliferative hepatocellular carcinoma in the total cohort (A), institution A (B), and institution B+C (C).