Figures & data
Table 1 Baseline Demographic Characteristics of Patients Who Achieved Clinical Complete Response
Figure 1 Flowchart of patient selection.
Abbreviations: uHCC, unresectable hepatocellular carcinoma; CR, complete response; ECOG-PS, Eastern Cooperative Oncology Group performance status; BCLC, Barcelona Clinic Liver Cancer; cCR, clinical complete response; TACE, transarterial chemoembolization; A+T, atezolizumab plus bevacizumab; PSM, propensity score matching.
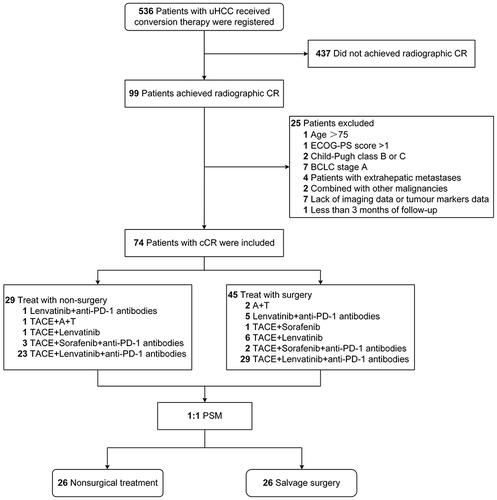
Figure 2 Swimmer’s plot of the clinical course and current status of 17 progressing patients.
Abbreviations: cCR, clinical complete response; DFS, disease-free survival; LTP, Local tumor progression; IDR, intrahepatic distant recurrence; EDR, extrahepatic distant recurrence; HCC, hepatocellular carcinoma; PCR, pathologic complete response; MPR, major pathologic response.
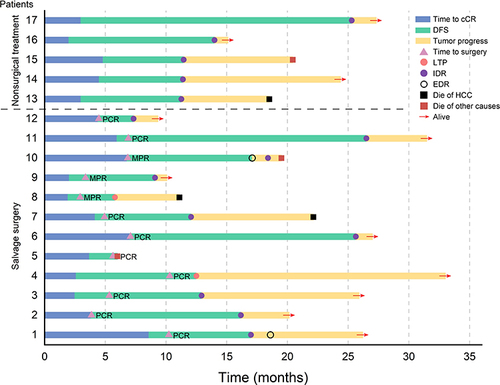
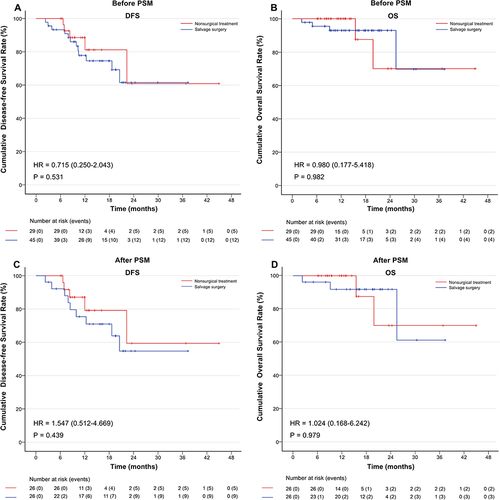
Figure 3 Kaplan–Meier analysis of the DFS and OS before (A and B) and after PSM (C and D).
Abbreviations: DFS, disease-free survival; OS, overall survival; HR, hazard ratio; PSM, propensity score matching.