Figures & data
Table 1 Baseline Characteristics of HBV-Related HCC Patients with and without PVTT
Table 2 Baseline Characteristics of the Three Cohorts
Figure 1 Comparison of clinical characteristics and prognosis between PVTT group and non-PVTT group. The values of AAPR (A), APRI (B), ALBI score (C), and tumor diameter (D) were marked differences between the PVTT group and the non-PVTT group. KM survival curves revealed that patients occurred PVTT events had poorer OS (E) and PFS (F) than patients without PVTT.
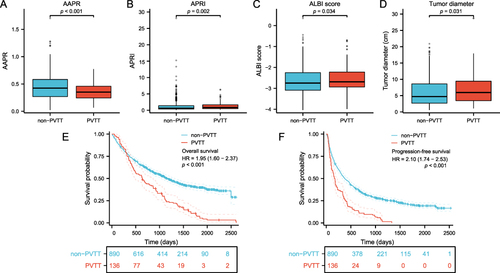
Figure 2 Cox regression analysis and forest plot of PVTT in the entire cohort.

Figure 3 Cox regression analysis and forest plots of OS (A) and PFS (B) in the training cohort.
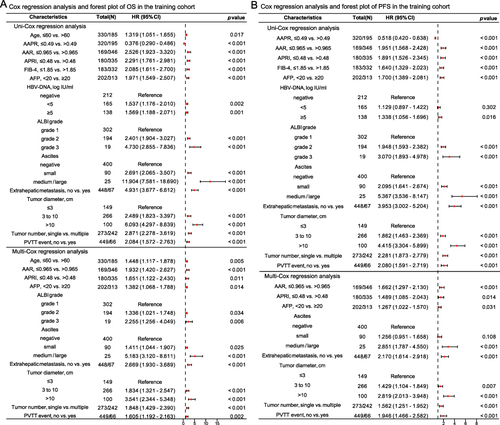
Figure 4 Construction and validation of the OS nomogram model. Nomogram predicting the OS for HBV-related HCC patients without PVTT (A). The calibration curves of the OS model for predicting 1‐, 3‐, and 5‐year OS in the training cohort (B), internal validation cohort (C), and external validation cohort (D). The time-dependent ROC curves of the OS model were used to evaluate the predictive ability of 1‐, 3‐, and 5‐year OS in the training cohort (E), internal validation cohort (F), and external validation cohort (G). The DCA curves of the OS model were performed to assess the clinical utility of 5‐year OS in the training cohort (H), internal validation cohort (I), and external validation cohort (J). KM survival analysis of OS among different risk groups based on the score of the OS nomogram model in the training cohort (K), internal validation cohort (L), and external validation cohort (M).
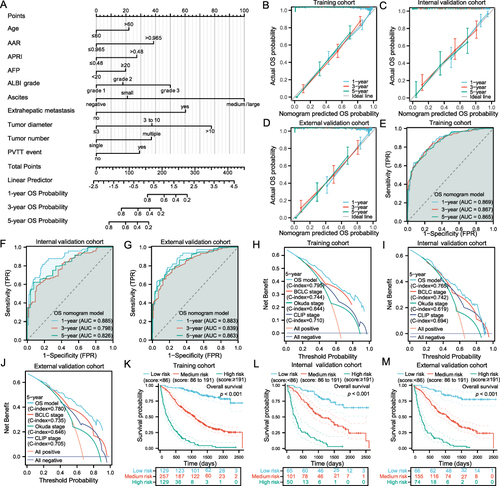
Figure 5 Construction and validation of the PFS nomogram model. Nomogram predicting the PFS for HBV-related HCC patients without PVTT (A). The calibration curves of the PFS model for predicting 1‐, 3‐, and 5‐year PFS in the training cohort (B), internal validation cohort (C), and external validation cohort (D). The time-dependent ROC curves of the PFS model were used to evaluate the predictive ability of 1‐, 3‐, and 5‐year PFS in the training cohort (E), internal validation cohort (F), and external validation cohort (G). The DCA curves of the PFS model were performed to assess the clinical utility of 5‐year PFS in the training cohort (H), internal validation cohort (I), and external validation cohort (J). KM survival analysis of PFS among different risk groups based on the score of the PFS nomogram model in the training cohort (K), internal validation cohort (L), and external validation cohort (M).
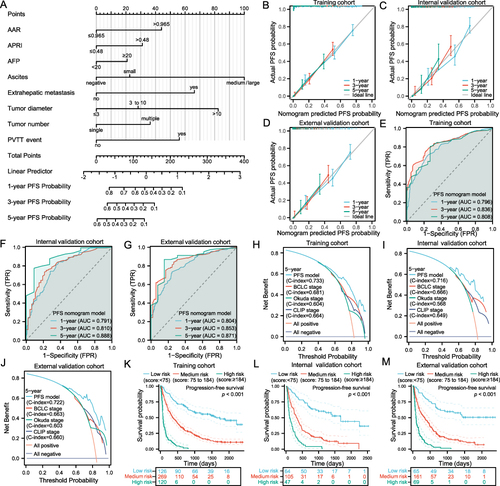
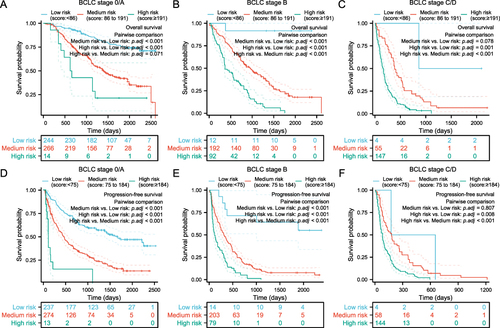
Figure 6 Subgroup survival analysis for the entire cohort stratified by the BCLC staging system. KM survival analysis of OS and PFS among different risk groups based on the score of the OS nomogram model and PFS nomogram model in BCLC stage 0/A patients (A and D), BCLC stage B patients (B and E), and BCLC stage C/D patients (C and F), respectively.