Figures & data
Figure 1 Dysregulated m6A/m5C/m1A genes identified from the bulk sequencing of The Cancer Genome Atlas (TCGA) cohort. *Indicates a significant change (p<0.05) between the hepatocellular carcinoma (HCC) and the adjacent para-cancerous liver tissue.
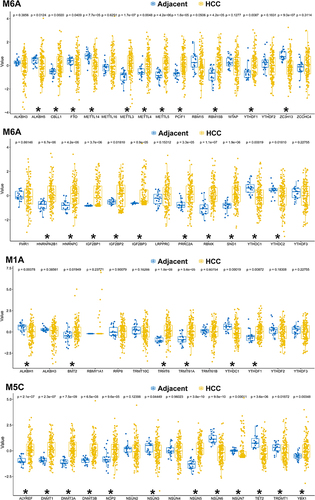
Figure 2 The clustered heatmap of the dysregulated m6A/m5C/m1A genes in HCC and in adjacent para-cancerous liver tissue.
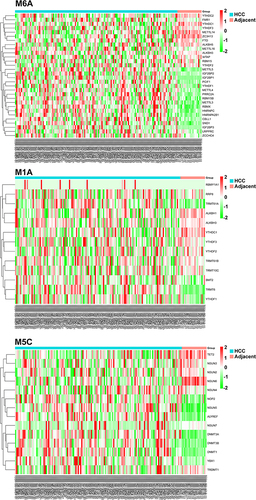
Table 1 The Dysregulated m6A/m5C/m1A Genes Identified from the scRNA-Seq in Different Cell Types in the HCC vs the Adjacent Para-Cancerous Liver Tissue
Figure 3 Single-cell RNA-sequencing analysis identified based on the HCC vs adjacent para-cancerous liver tissue, GSE categories, cell cycles, and major clusters of the cells.
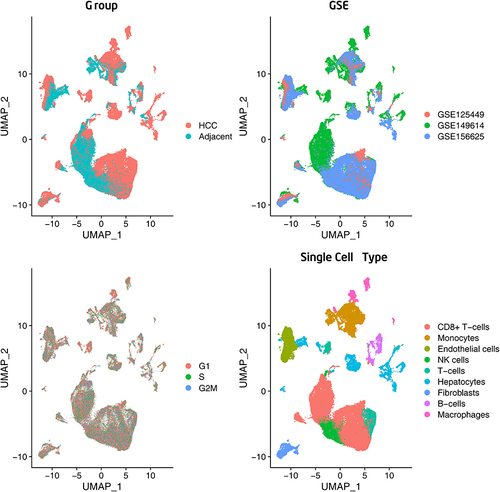
Figure 4 (A) The bubble plot conducted to visualize the distribution of m6A/m5C/m1A genes among different cell types. To evaluate the statistical significance of each interaction score, a one-sided Wilcoxon rank-sum test was employed. (B) The river plot shows the association of dysregulated m6A/m5C/m1A genes to different cell types. GSE, Gene Series Accession; UMAP, Uniform Manifold Approximation and Projection; G1, Gap 1; S, Synthesis of DNA; G2 M, Gap 2 and Mitosis. (C) Summary of the expression of scRNA-seq-identified dysregulated m6A/m5C/m1A genes in the bulk sequencing from TCGA cohort. (D) The clustered heatmap of these dysregulated m6A/m5C/m1A genes in HCC and in adjacent para-cancerous liver tissue according to the bulk sequencing from TCGA cohort. *Indicates a significant change (p<0.05) between the hepatocellular carcinoma (HCC) and the adjacent para-cancerous liver tissue.
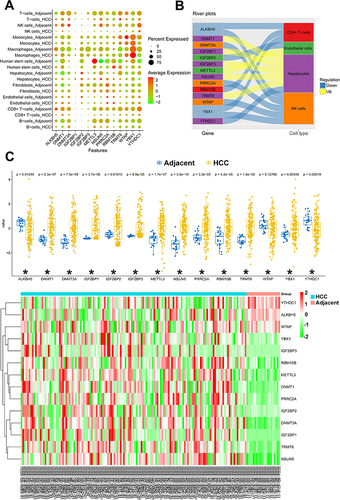
Figure 5 (A) A real-time PCR was performed to measure the expression of dysregulated m6A/m5C/m1A genes identified from the scRNA-seq. (B) A real-time PCR was performed to measure the expression of dysregulated m6A/m5C/m1A genes identified from selected representative dysregulated m6A/m5C/m1A genes from TCGA. (C) Kaplan–Meier (K–M) survival analysis of six dysregulated methylation-related genes using Timer2.0. *Indicates a significant change (p<0.05) between the hepatocellular carcinoma (HCC) and the adjacent para-cancerous liver tissue.
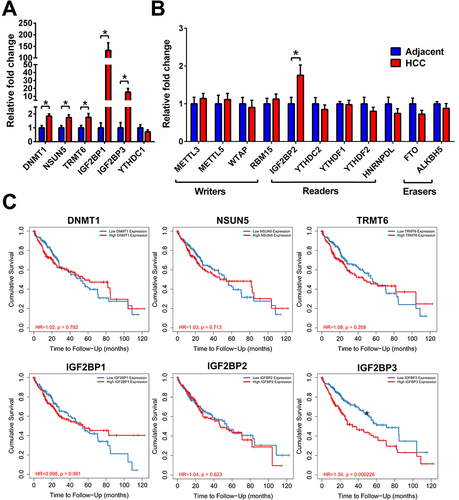
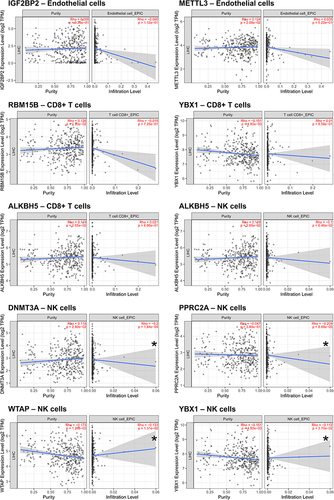
Figure 6 Correlation of dysregulated m6A/m5C/m1A genes with immune cell infiltration using Timer2.0. *Indicates a significant change (p<0.05) of the type of infiltrated cells between the hepatocellular carcinoma (HCC) and the adjacent para-cancerous liver tissue.