
Figures & data
Table 1 Baseline characteristics of patients (n=126)
Table 2 Comparison between patients with and without AFP response
Table 3 Independent predictors of overall survival
Figure 1 Kaplan–Meier curves of overall survival (OS) (A) and progression-free survival (PFS) (B) according to α-fetoprotein (AFP) response. Patients with an AFP response had significantly longer OS and PFS than patients without an AFP response (median 10.9 versus 5.2 months, log-rank test P=0.001 for OS and 5.3 versus 2.9 months, log-rank test P<0.001 for PFS).
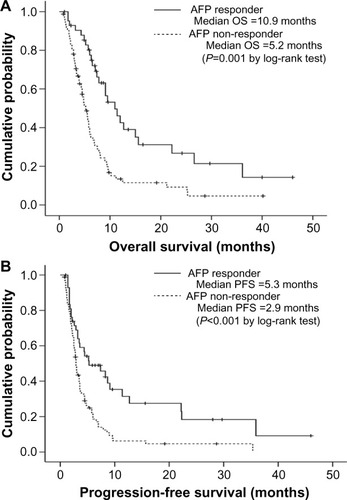
Table 4 Independent predictors of progression-free survival
Figure 2 curves of overall survival (OS) (A) and progression-free survival (PFS) (B) according to α-fetoprotein (AFP) response among patients with stable disease at the first radiological response evaluation. Patients with an AFP response had significantly longer OS and PFS than patients without an AFP response (median 12.7 versus 5.8 months, log-rank test P=0.027 for OS and 9.1 versus 3.7 months, log-rank test P=0.019 for PFS).
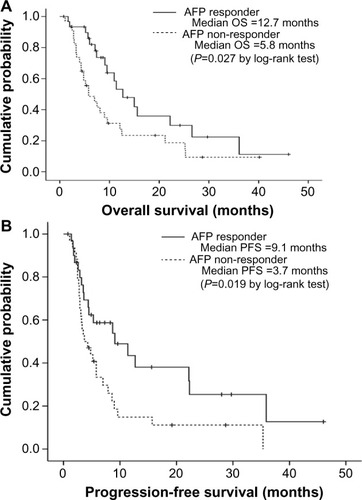
Table 5 Adverse events
Figure S1 Kaplan–Meier analysis according to log relative hazard ratio (LRHR) which was established using four independent risk factors: LRHR = exp[0.63 × Child-Pugh class (A=0, B=1) + 1.0 × tumor size (<10 cm=0, ≥10 cm=1) + 0.9 × portal vein invasion (absence =0, presence =1) + 0.9 × AFP response (presence =0, absence =1)]. When the study population was stratified according to the mean LRHR value, patients with LRHR <4 showed significantly better OS compared to those with LRHR ≥4 [median 6.2 months (95% CI, 3.8–8.5) versus 2.9 months (95% CI, 1.7–4.0), P<0.001 by log-rank test).
Abbreviations: OS, overall survival; AFP, α-fetoprotein; CI, confidence interval.
![Figure S1 Kaplan–Meier analysis according to log relative hazard ratio (LRHR) which was established using four independent risk factors: LRHR = exp[0.63 × Child-Pugh class (A=0, B=1) + 1.0 × tumor size (<10 cm=0, ≥10 cm=1) + 0.9 × portal vein invasion (absence =0, presence =1) + 0.9 × AFP response (presence =0, absence =1)]. When the study population was stratified according to the mean LRHR value, patients with LRHR <4 showed significantly better OS compared to those with LRHR ≥4 [median 6.2 months (95% CI, 3.8–8.5) versus 2.9 months (95% CI, 1.7–4.0), P<0.001 by log-rank test).Abbreviations: OS, overall survival; AFP, α-fetoprotein; CI, confidence interval.](/cms/asset/007fd7d7-423f-402d-a0f0-445320c8e0bf/djhc_a_79353_sf0001_b.jpg)