Figures & data
Figure 1 Diagram of the portal venous anatomy to the liver.
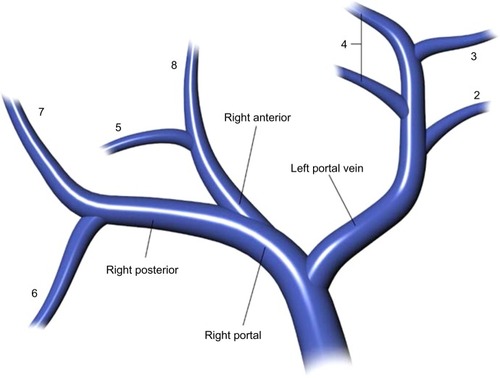
Figure 2 Diagram of the arterial anatomy to the liver.
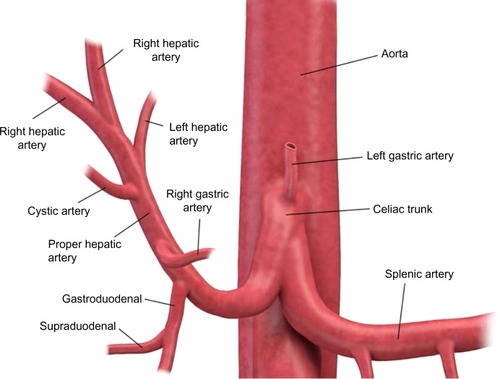
Figure 3 (A) Axial maximum intensity projection image at the level of the celiac artery. The common hepatic (hep.), splenic, and right gastric arteries are identified. (B) Axial “iodine-material” image at the level of the celiac artery. The common hepatic, splenic, and right gastric arteries are identified. (C) Coronal “iodine-material” image at the level of the celiac and superior mesenteric arteries. The common hepatic, left gastric, splenic, and superior mesenteric arteries are identified.
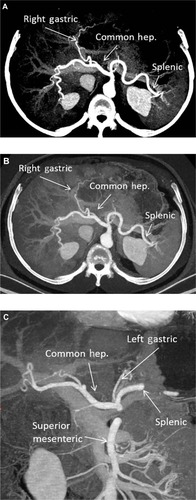
Figure 4 (A) Post-gadolinium magnetic resonance axial images of the abdomen below the level of the celiac artery. The common hepatic (hep.), splenic, and right gastric arteries are identified. (B) Post-gadolinium magnetic resonance coronal maximum intensity projection of the abdomen. The common hepatic and splenic arteries are identified. (C) Post-gadolinium magnetic resonance axial maximum intensity projection of the abdomen. The common hepatic and splenic arteries are identified.
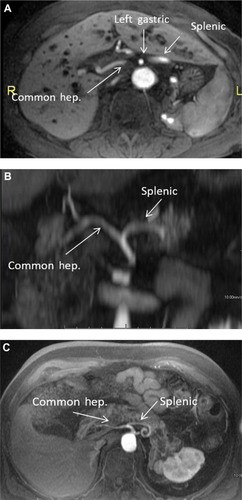
Figure 5 (A) Phase contrast (nongadolinium) magnetic resonance axial images of the abdomen below the level of the celiac artery. The splenic vein (v.) and portal confluence are identified. The bright signal shows normal directional flow of the splenic vein. (B) Post-gadolinium magnetic resonance axial images of the abdomen below the level of the celiac artery. The splenic vein and portal confluence are identified. This corresponds to the anatomy seen in (A).
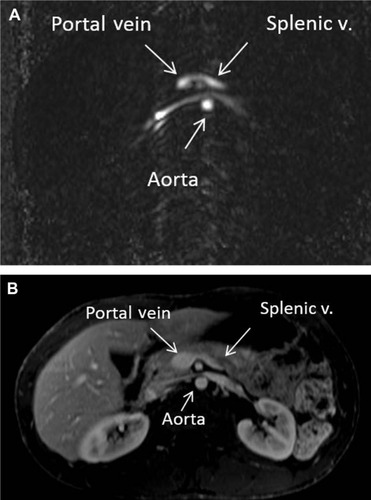
Figure 6 CTCP with minimum intensity projection.
Abbreviation: CTCP, computed tomographic cholangiopancreatography.
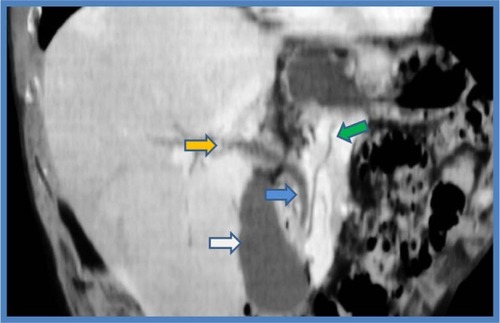
Figure 7 MRCP.
Abbreviations: MRCP, magnetic resonance cholangiopancreatography; MRI, magnetic resonance imaging; CBD, common bile duct; LHD, left hepatic duct; RHD, right hepatic duct; RAHD, right anterior hepatic duct; RPHD, right posterior hepatic duct.
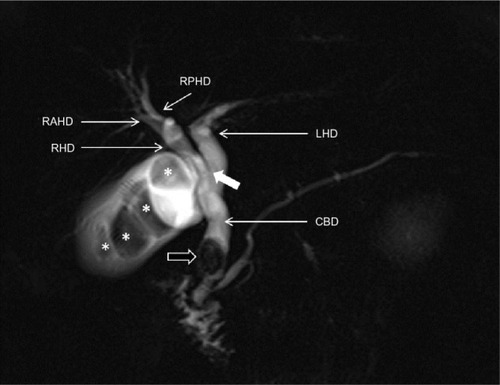
Figure 8 MRCP with Gd-EOB-DTPA.
Abbreviations: Gd-EOB-DTPA, gadolinium ethoxybenzyl diethylenetriamine pentaacetic acid; MRCP, magnetic resonance cholangiopancreatography.
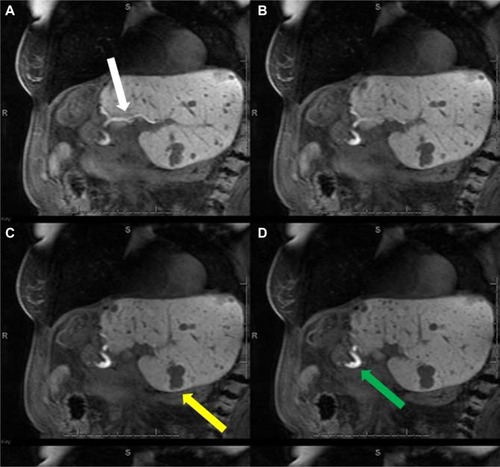
Figure 9 MRCP with Gd-EOB-DTPA.
Abbreviations: Gd-EOB-DTPA, gadolinium ethoxybenzyl diethylenetriamine pentaacetic acid; MRCP, magnetic resonance cholangiopancreatography.
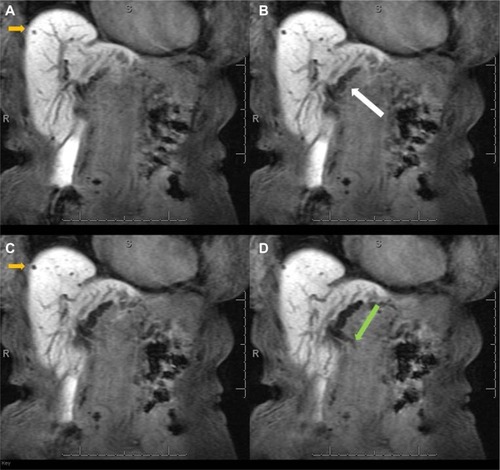
Figure 10 CT image of fatty liver disease.
Abbreviations: CT, computed tomography; HU, Hounsfield units.
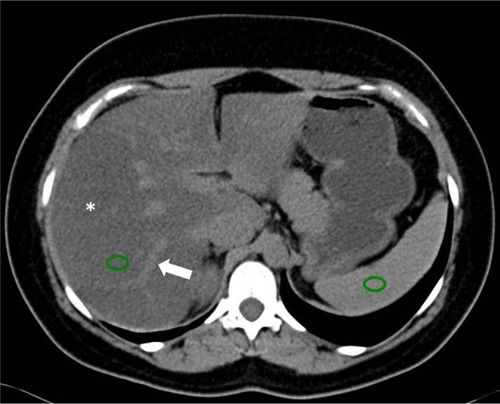
Figure 11 MRI of fatty liver disease.
Abbreviations: T1W, T1-weighted; MRI, magnetic resonance image.
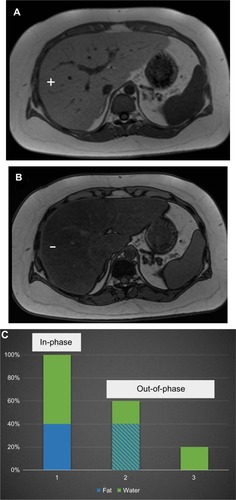
Figure 12 MRI of the abdomen with the Dixon technique.
Abbreviations: T1W, T1-weighted; MRI, magnetic resonance image.
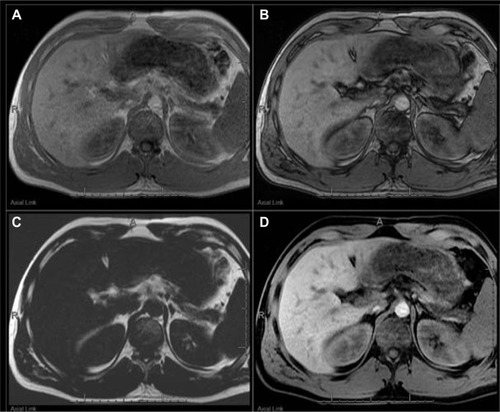
Figure 13 CT image showing liver iron overload.
Abbreviations: CT, computed tomography; HU, Hounsfield units.
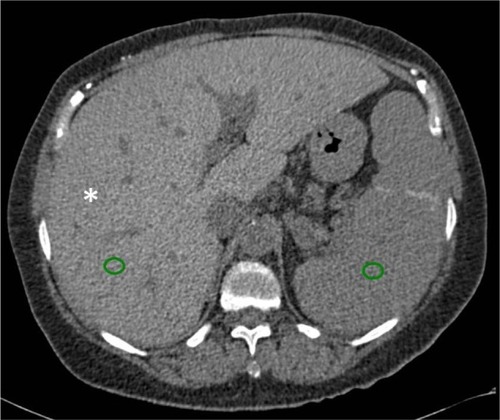
Figure 14 MRI showing iron overload.
Abbreviations: MRI, magnetic resonance image; T1W, T1-weighted; TE, time of echo.
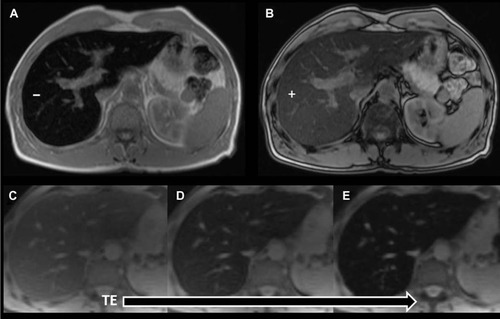
Figure 15 MRI showing iron overload in the liver and pancreas.
Abbreviations: MRI, magnetic resonance image; T1W, T1-weighted.
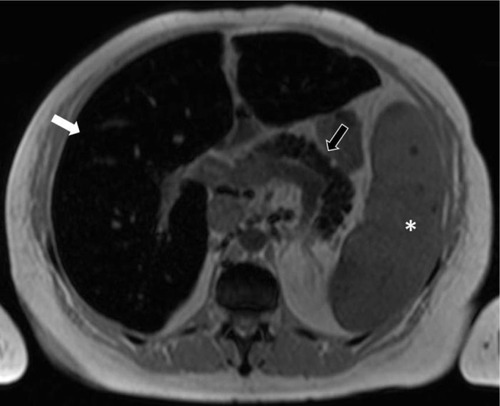
Figure 16 Axial post-contrast CT image in a patient with cirrhosis.
Abbreviation: CT, computed tomography.
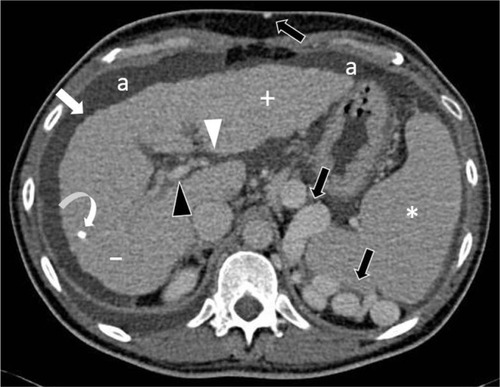
Figure 17 MRIs showing cirrhosis.
Abbreviations: Gd-EOB-DTPA, gadolinium ethoxybenzyl diethylenetriamine pentaacetic acid; MRIs, magnetic resonance images.
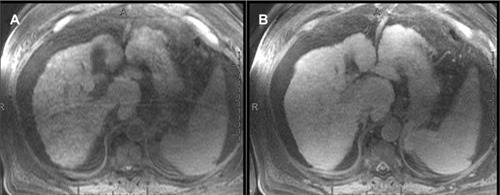
Figure 18 MR elastography.
Abbreviation: MR, magnetic resonance.
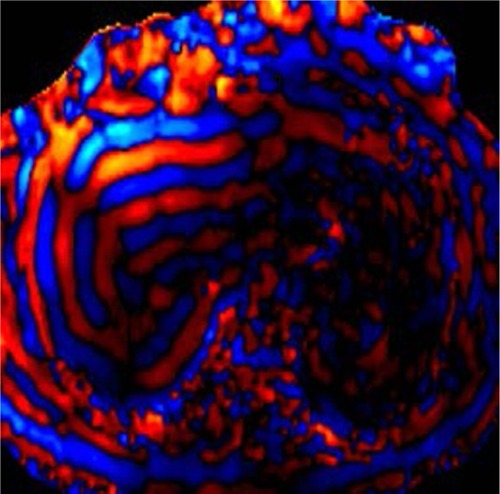
Figure 19 MRIs showing focal fat.
Abbreviations: MRIs, magnetic resonance images; T1W, T1-weighted.
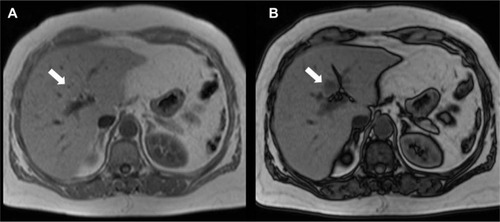
Figure 20 MRI showing focal iron.
Abbreviation: MRI, magnetic resonance image.
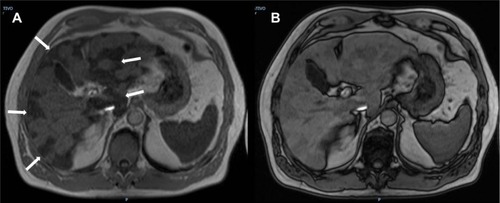
Figure 21 Radiation changes in the liver.
Abbreviation: Gd-EOB-DTPA, gadolinium ethoxybenzyl diethylenetriamine pentaacetic acid.
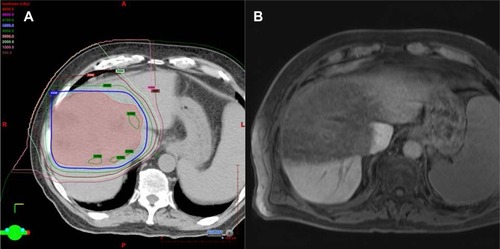
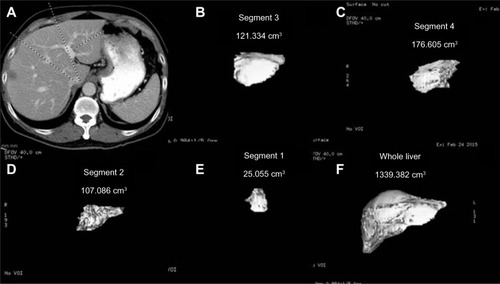
Figure 22 Liver volumetry.