
Figures & data
Figure 1 Participants flow diagram
Abbreviation: CEO, chief executive officer.
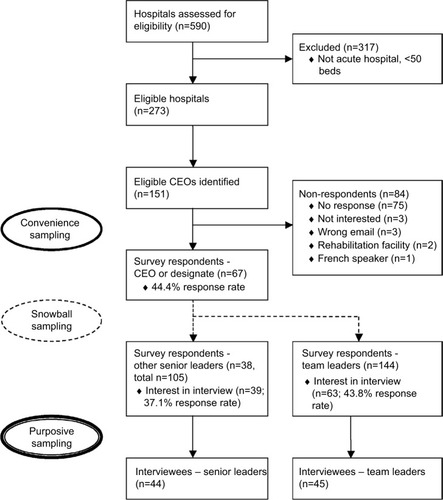
Table 1 Distribution of survey and interview participants by region, N (%)
Table 2 Characteristics of senior leader and team leader survey respondents, N (%)
Table 3 Facilitators and barriers to establishing/implementing QS teams, N (%)
Table 4 Facilitators and barriers to measuring the impact of QS teams, N (%)