
Figures & data
Table 1 Demographics of Survey Participants (N = 366)
Table 2 Survey on Belonging and Likelihood of Leaving
Figure 1 Distribution of belonging factors experienced by survey participants in their current healthcare workplace. (A) Frequency of experiencing each of the 10 belonging factors. (B) Frequency in the number of belonging factors experienced.
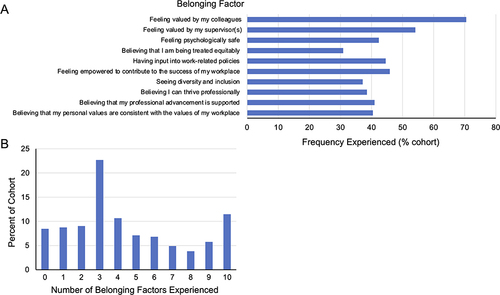
Figure 2 Likelihood of leaving in relation to the number of belonging factors experienced (A) and years working in current workplace for URM versus non-URM adjusted for the cumulative experience of workplace belonging (B).
Notes: Shaded area in (A) represents 95% CI about expected likelihood of leaving.
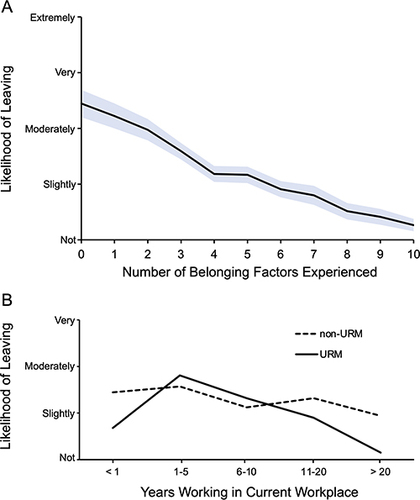
Table 3 Ranking of Predictors by Dominance Analysis