Figures & data
Figure 1 Increased expression of H3K4me3 and relevant epithelial gene mRNA expression in nasal polyps.
Notes: (A) mRNA expression of FOXJ1, DNAI2, MUC5a, and CLCA1 compared with the control group. (B) H3K4me3 expression was measured in nasal polyps by immunoblotting and compared with the control. (C) Relative quantification of H3K4me3 intensity normalized by β-tubulin in tissues. Data are expressed as mean ± SD. *P < 0.05, Student’s t-test.
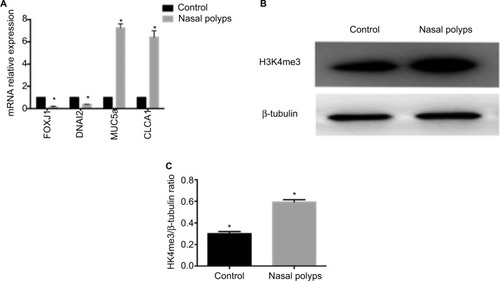
Figure 2 H3K4me3 and MLL1 protein expression and nasal epithelial hallmark gene mRNA expression with IL-13 treatment.
Notes: (A) H3K4me3 expression was measured in HNEpC treated with IL-13 at indicated concentration. (B) Relative quantification of H3K4me3 intensity normalized by β-tubulin. (C) Relative mRNA expression of FOXJ1, DNAI2, MUC5a, and CLCA1 in HNEpC treated with 10 ng/mL IL-13. (D) Relative mRNA expression of H3K4me3 methyltransferase and demethylase was measured in IL-13-treated HNEpC. (E) MLL1 expression was measured in HNEpC with IL-13 treatment. (F) Relative quantification of MLL1 intensity normalized by β-tubulin. Data are expressed as mean ± SD. *P < 0.05, **P < 0.01, Student’s t-test.
Abbreviation: HNEpC, human nasal epithelial cells.
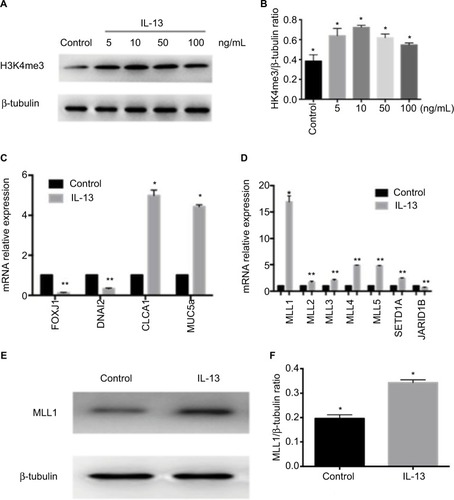
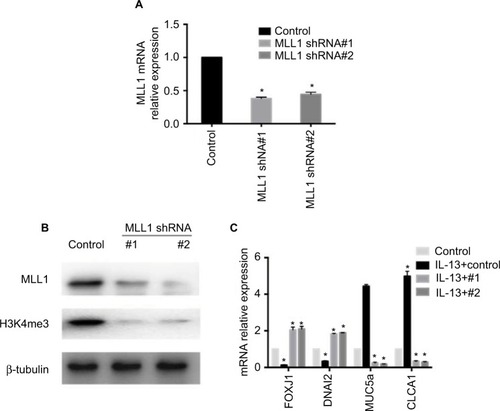
Figure 3 Knockdown of MLL1 reversed IL-13-induced changes of gene expression in HNEpC.
Notes: (A) MLL1 mRNA and (B) protein expression were measured upon MLL1 silencing. (C) Relative mRNA expression of nasal epithelial hallmark genes upon MLL1 knockdown in IL-13-treated HNEpC. Data are expressed as mean ± SD. *P < 0.05; Student’s t-test.
Abbreviation: HNEpC, human nasal epithelial cells.