
Figures & data
Table 1 Effect of moderate (MG) and excessive glucose (EG) supply on vital, blood, and plasma parametersTable Footnotea during systemic inflammation
Table 2 Effect of moderate (MG) and excessive glucose (EG) supply on parameters of thromboelastometryTable Footnotea during systemic inflammation
Figure 1 Effect of moderate (MG) and excessive glucose supply (EG) on systemic blood pressure (A) and plasma concentration of cell-free hemoglobin (B) during systemic inflammation. Lipopolysaccharide (LPS) was infused at a rate of 1 mg/kg and h over a period of 300 min to induce systemic inflammation in male Wistar rats. Glucose was supplied either moderately (LPS+MG: 1 mg LPS/kg and h + 70 mg glucose/kg and h) or excessively (LPS+EG: 1 mg LPS/kg and h + 210 mg glucose/kg and h) during systemic inflammation. Systemic blood pressure and plasma concentration of cell-free hemoglobin are shown as mean values ± standard errors of mean.
Figure 2 Effect of moderate (MG) and excessive glucose supply (EG) on plasma concentrations of glucose (A) and lactate (B) during systemic inflammation. Lipopolysaccharide (LPS) was infused at a rate of 1 mg/kg and h over a period of 300 min to induce systemic inflammation in male Wistar rats. Glucose was supplied either moderately (LPS+MG: 1 mg LPS/kg and h + 70 mg glucose/kg and h) or excessively (LPS+EG: 1 mg LPS/kg and h + 210 mg glucose/kg and h) during systemic inflammation. Plasma concentrations of glucose and lactate are shown as mean values ± standard errors of mean.
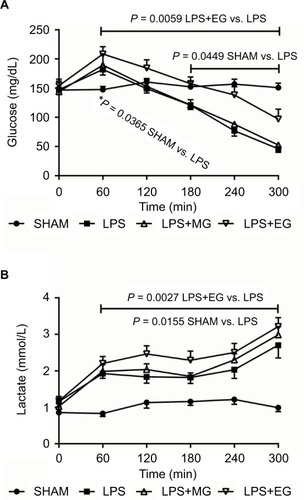
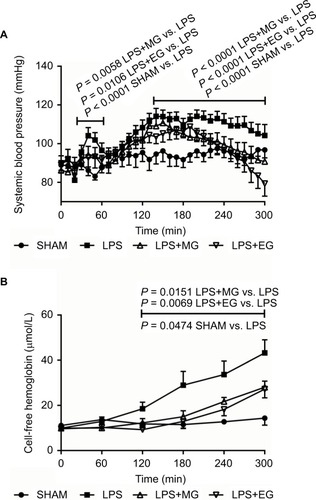
Figure 2 Effect of moderate (MG) and excessive glucose supply (EG) on plasma concentrations of glucose (A) and lactate (B) during systemic inflammation. Lipopolysaccharide (LPS) was infused at a rate of 1 mg/kg and h over a period of 300 min to induce systemic inflammation in male Wistar rats. Glucose was supplied either moderately (LPS+MG: 1 mg LPS/kg and h + 70 mg glucose/kg and h) or excessively (LPS+EG: 1 mg LPS/kg and h + 210 mg glucose/kg and h) during systemic inflammation. Plasma concentrations of glucose and lactate are shown as mean values ± standard errors of mean.