
Figures & data
Figure 1 Structures of IL-12 and IL-23, their receptors and the site of action of UST.
Notes: IL-12 is composed of both p40 and p35 subunits, while IL-23 is composed of p40 and p19 subunits. IL-12 receptor is composed of two subunits, such as IL-12Rβ1 and IL-12Rβ2. IL-23 receptor is composed of two subunits, such as IL-12Rβ1 and IL-23R.
Abbreviations: IL, interleukin; IL-23R, IL-23 receptor; UST, ustekinumab.
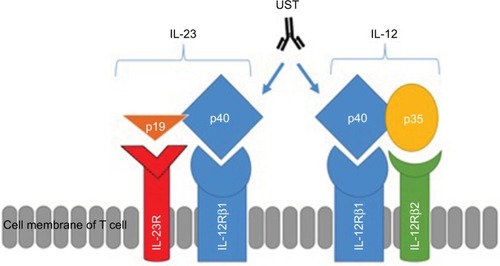
Figure 2 Clinical response in Phase IIa trial of UST in population 1 (n=104 randomized patients).
Notes: The primary endpoint (clinical response at week 8) was not met, and the trial was considered negative. However, a significant difference in clinical response was observed at weeks 4 and 6. Data from Sandborn et al.Citation18
Abbreviation: UST, ustekinumab.
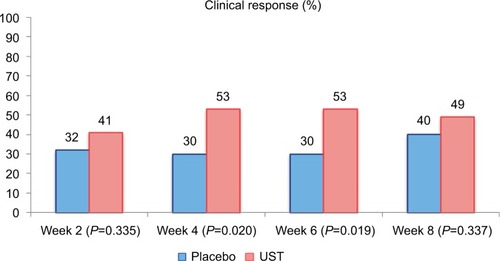
Figure 3 Clinical response rates at week 6 (induction) in the CERTIFI trial (primary outcome).
Notes: Statistical significance reached in the UST 1 and 6 mg/kg groups. Data from Sandborn et al.Citation19
Abbreviation: UST, ustekinumab.
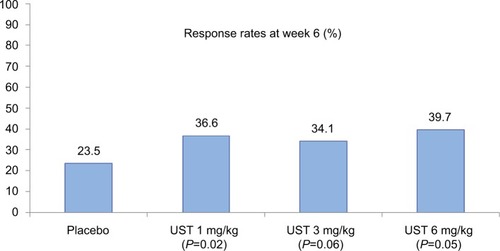
Figure 4 Primary endpoint results of the UNITI-1 and UNITI-2 studies.
Notes: Clinical response at week 6 was more prevalent in the UST-treated groups. In UNITI-1, P-values as compared to placebo were 0.002 (UST 130 mg) and 0.003 (UST 6 mg/kg). In UNITI-2, P-values as compared to placebo were <0.001 for both UST 130 mg and UST 6 mg/kg. Data from Feagan et al.Citation17
Abbreviation: UST, ustekinumab.
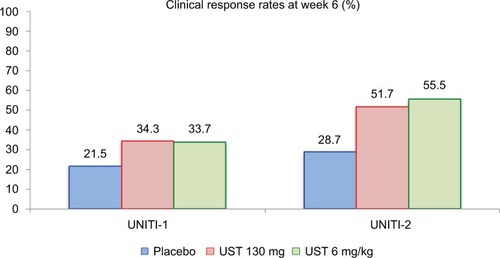
Figure 5 Clinical remission rates at week 44 of the IM-UNITI maintenance study.
Notes: In the pooled overall UST group, P=0.040 (q12 weeks) and P=0.005 (q8 weeks) for UST as compared to placebo. Among patients derived from the UNITI-1 induction trial, P=0.14 (q12 weeks) and P=0.10 (q8 weeks). Among patients derived from UNITI-2 trial, P=0.15 (q12 weeks) and P=0.02 (q8 weeks). Data from Feagan et al.Citation17
Abbreviation: UST, ustekinumab.
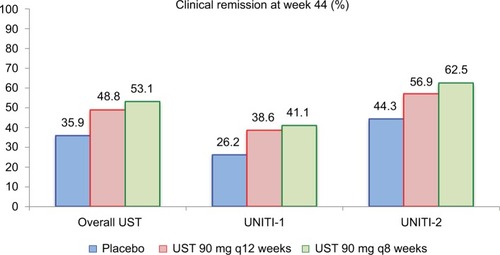
Table 1 Summary of open-label cohorts of UST for Crohn’s disease