Figures & data
Figure 1 Chemical structure and molecular data of the investigated compounds.
Abbreviation: MW, molecular weight.
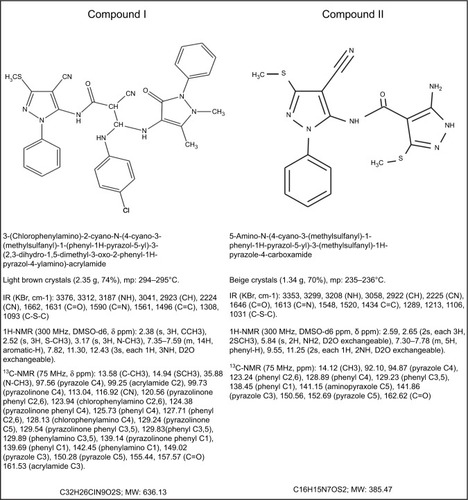
Figure 2 Dose–response relationship of compounds I, II and diclofenac sodium based on formalin-induced paw edema method.
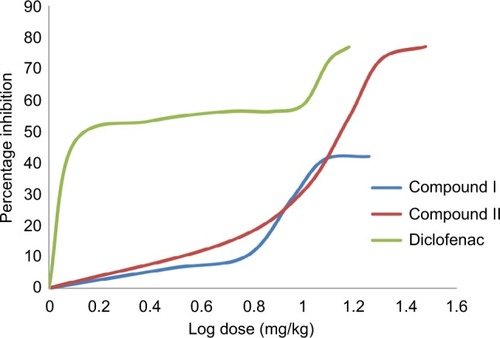
Table 1 Effect of compound I, compound II and the standard drug diclofenac sodium on granuloma and exudate weights in the mice cotton pellet granuloma test
Table 2 Renal and hepatic function biomarkers after treatment period of 7 and 30 days
Table 3 EGTI scores of compounds I, II and diclofenac sodium mice kidneys after treatment periods of 7 and 30 days
Figure 3 Histological features of mice kidney after treatment with compounds I, II or diclofenac for 7 and 30 days.
Notes: (A) Kidney of mice taking compound I for 7 days showing hemorrhage and retraction of glomerular tuft (arrows); (B) kidney of mice taking compound II for 7 days showing some retraction of glomerular tuft (arrow); (C) kidney of mice that received diclofenac for 7 days showing tubular destruction, hemorrhage and necrosis (arrow); (D) kidney of the control after 7 days; (E) kidney of mice taking compound I for 30 days showing hemorrhage, retraction of glomerular tuft, loss of brush border integrity and thickened basement membrane (arrow); (F) kidney of mice taking compound II for 30 days showing hemorrhage, retraction of glomerular tuft, loss of brush border, cast formation and necrosis (arrows); (G) kidney of diclofenac receiving mice for 30 days showing loss of bundle brush border and casts in tubules (arrow); (H) control kidney after 30 days. Photos were taken at 40× magnification.
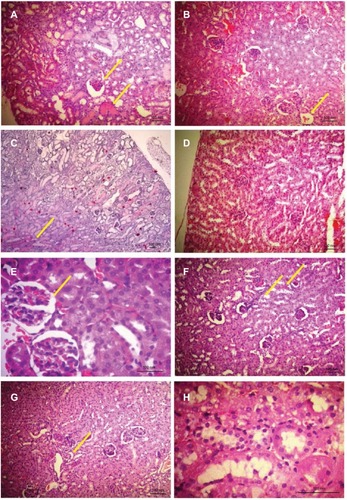
Table 4 Liver histology results after 7 and 30 days of treatment
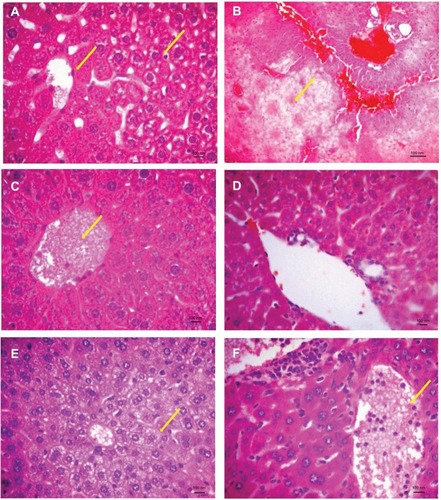
Figure 4 Histological features of mice liver treated with compounds I, II or diclofenac for 7 and 30 days.
Notes: (A) Liver of compound I treated mice showing vacuolization, edema and some hepatocytes necrosis after 7 days (arrows); (B) liver of compound II treated mice showing severe ballooning and congestion after 7 days (arrow); (C) liver of diclofenac sodium (arrow indicates congestion); (D) liver of control mice showing normal architecture; (E) liver of compound I treated mice showing vacuolization after 30 days (arrow); (F) liver of diclofenac treated mice showing congestion after 30 days (arrow). Photos were taken at 40× magnification.