Figures & data
Table 1 Demographic characteristics of the study participants
Table 2 Association of ALS and other cytokines in predicting TB cases and hospitalized controls
Figure 1 Unstimulated PBMC cytokine responses among TB cases and controls.
Notes: (A–F): TB cases are shown in green and hospitalized controls in red. Data presented in log10 pg/ml. The figures are arranged depending on their scale, from the highest scale (A), consecutively to the lowest scale (F). Lines show the median with interquartile ranges. Mann–Whitney U test was used for comparison between groups. Bonferroni correction was applied, and a P-value of 0.002 was considered significant.
Abbreviations: FGF-basic, fibroblast growth factor-basic; G-CSF, granulocyte-colony stimulating factor; GM-CSF, granulocyte macrophage-colony stimulating factor; IFN-γ, interferon-gamma; McP-1, monocyte chemoattractant protein-1; MIP-1α, monocyte inducible protein-1α; MIP-1β, monocyte inducible protein-1β; PBMC, peripheral blood mononuclear cell; PDGF-bb, platelet-derived growth factor-bb; TB, tuberculosis; TNF-α, tumor necrosis factor-alpha; VEGF, vascular endothelial growth factor.
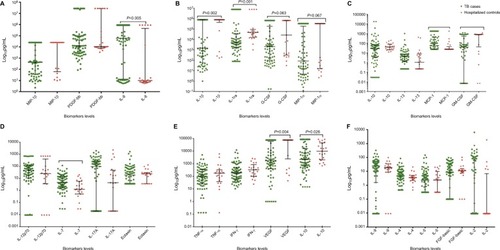
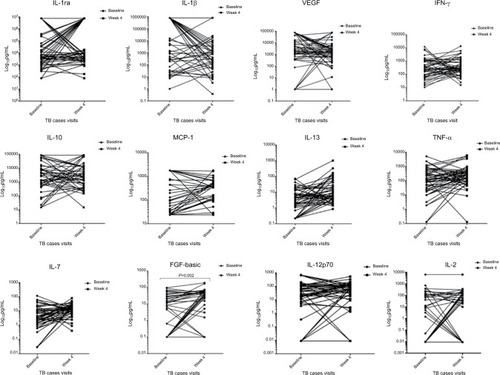
Figure 2 comparison of cytokine levels among TB cases before and after 4 weeks of TB treatment.
Notes: Figures depicting the longitudinal changes of cytokine, chemokine, and growth factor expression among TB cases, n=73. Concentrations are shown at baseline and at week 4 of treatment and results are expressed as Log10 pg/ml. Statistical analyses were performed using non-parametric Wilcoxon paired test and a P=0.002 was considered significant. FGF-basic significantly increased over time (P=0.002).
Abbreviations: TNF-α, tumor necrosis factor-alpha; FGF-basic, fibroblast growth factor-basic; MCP-1, monocyte chemoattractant protein-1; TB, tuberculosis; TNF-α, tumor necrosis factor-alpha; VEGF, vascular endothelial growth factor.