
Figures & data
Figure 1 Biochemical profile of C, PA, and LA groups at 12 and 18 months of age.
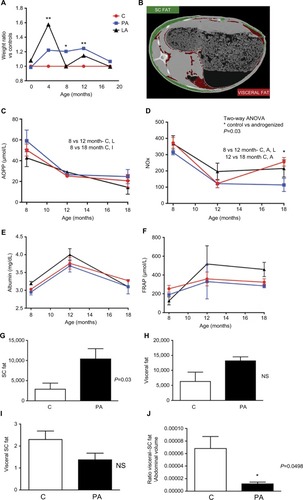
Figure 2 Weight, oxidative stress markers, and fat depot analysis (CT).
Notes: (A) Ratio of weight of C (red), PA sheep (blue), and LA sheep (black). (B) CT image of an abdominal section; images in red and green identify (with the support of the software analyze 12.0) subcutaneous and visceral fat depots, respectively. Measures of AOPP (C), NOx (D), albumin (E), and FRAP (F) staring from 8th to 18th month of age in c sheep (red), PA sheep (blue), and LA sheep (black). Values of (G) subcutaneous fat mass and (H) visceral fat, both obtained by the use of analyze 12.0 software. (I) Ratio of visceral to subcutaneous fat and (J) ratio of visceral to subcutaneous fat adjusted to the abdominal area. Results (C–J) show mean ± SEM. *Indicates statistical significance of weight in kilograms with P<0.05 (ANOVA). **P<001.
Abbreviations: AOPP, advanced oxidation products of proteins; C, control; CT, computed tomography; FRAP, ferric-reducing antioxidant power; LA, prenatally androgenized sheep treated with leuprolide acetate; NOx, nitric oxide; NS, nonsignificant; PA, prenatally androgenized; SC, subcutaneous; SEM, standard error of the mean.
Notes: Animals at 12 months: (A) total cholesterol, (B) HDL cholesterol, (E) LDL cholesterol, (F) triglycerides, (I) glucose, (J) TYG index, (M) uric acid. Animals at 18 months: (C) total cholesterol, (D) HDL cholesterol, (G) LDL cholesterol, (H) triglycerides, (K) glucose, (L) TYG index, (N) uric acid. Results show mean + SEM. Number of ewes evaluated at 12 months: C, n=7; Pa, n=6; LA, n=3. Number of ewes evaluated at 18 months: C, n=4; Pa, n=4; LA, n=3. Superscript letters a and b indicate that they are statistically different (ANOVA test).
Abbreviations: C, control; HDL, high-density lipoprotein; la, prenatally androgenized sheep treated with leuprolide acetate; LDL, low-density lipoprotein; Pa, prenatally androgenized; SEM, standard error of the mean.
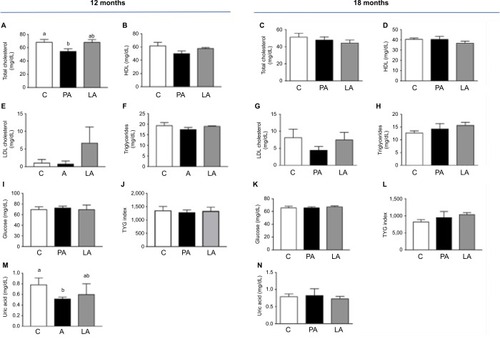
Figure 2 Weight, oxidative stress markers, and fat depot analysis (CT).
Notes: (A) Ratio of weight of C (red), PA sheep (blue), and LA sheep (black). (B) CT image of an abdominal section; images in red and green identify (with the support of the software analyze 12.0) subcutaneous and visceral fat depots, respectively. Measures of AOPP (C), NOx (D), albumin (E), and FRAP (F) staring from 8th to 18th month of age in c sheep (red), PA sheep (blue), and LA sheep (black). Values of (G) subcutaneous fat mass and (H) visceral fat, both obtained by the use of analyze 12.0 software. (I) Ratio of visceral to subcutaneous fat and (J) ratio of visceral to subcutaneous fat adjusted to the abdominal area. Results (C–J) show mean ± SEM. *Indicates statistical significance of weight in kilograms with P<0.05 (ANOVA). **P<001.
Abbreviations: AOPP, advanced oxidation products of proteins; C, control; CT, computed tomography; FRAP, ferric-reducing antioxidant power; LA, prenatally androgenized sheep treated with leuprolide acetate; NOx, nitric oxide; NS, nonsignificant; PA, prenatally androgenized; SC, subcutaneous; SEM, standard error of the mean.