
Figures & data
Table 1 PCR primer structures and targets definition
Figure 1 Expression of Nf-kb in the liver of rats tolerant and susceptible to hypoxia after 3, 6 and 24 hours of LPS administration (Me; 25%–75%).
Notes: In all groups there were 5 observations except the tolerant group after 24 hours of LPS injection, in which were 8. Statistical significance of differences (P-value) is determined by the Kruskal–Wallis method.
Abbreviation: LPS, lipopolysaccharide.
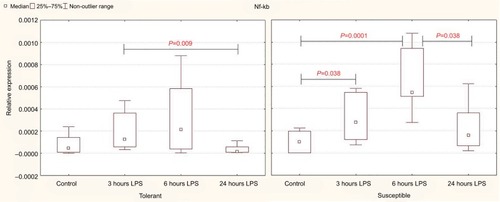
Table 2 The expression level of mRNA Nf-kb and Hif-1α in the liver of rats tolerant and susceptible to hypoxia after 3, 6 and 24 hours of LPS administration (Me; 25%–75%)
Figure 2 Expression of Hif-1α in the liver of rats tolerant and susceptible to hypoxia after 3, 6 and 24 hours of LPS administration (Me; 25%–75%).
Notes: In all groups there were 5 observations except the tolerant group after 24 hours of LPS injection, in which were 8. Statistical significance of differences (P-value) is determined by the Kruskal–Wallis method.
Abbreviation: LPS, lipopolysaccharide.
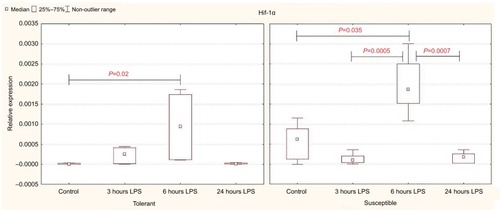
Table 3 The serum IL-1β and spleen IL-10 levels in rats tolerant and susceptible to hypoxia after 3, 6 and 24 hours of LPS administration (Me; 25%–75%)
Figure 3 Serum IL-1β levels in rats tolerant and susceptible to hypoxia after 3, 6 and 24 hours of LPS administration (Me; 25%–75%).
Notes: In all groups there were 5 observations except the tolerant group after 24 hours of LPS injection, in which were 8. Statistical significance of differences (P-value) is determined by the Kruskal–Wallis method.
Abbreviation: LPS, lipopolysaccharide.
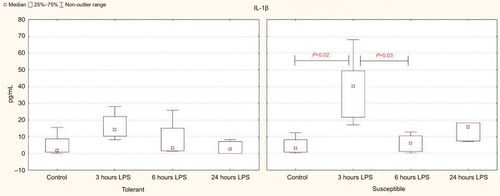
Figure 4 IL-10 production by spleen cells activated by Concanavalin A in rats tolerant and susceptible to hypoxia after 3, 6 and 24 hours of LPS administration (Me; 25%–75%).
Notes: In all groups there were 5 observations except the tolerant group after 24 hours of LPS injection, in which were 8. Statistical significance of differences (P-value) is determined by the Kruskal–Wallis method.
Abbreviation: LPS, lipopolysaccharide.
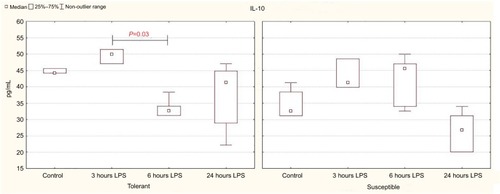
Table 4 serum TGF-β level in rats tolerant and susceptible to hypoxia after 3, 6 and 24 hours of LPS administration (Me; 25%–75%)
Figure 5 TGF-β serum levels in rats tolerant and susceptible to hypoxia after 3, 6 and 24 hours of LPS administration (Me; 25%–75%).
Notes: In all groups there were 5 observations except the tolerant group after 24 hours of LPS injection, in which were 8. Statistical significance of differences (P-value) is determined by the Kruskal–Wallis method.
Abbreviation: LPS, lipopolysaccharide.
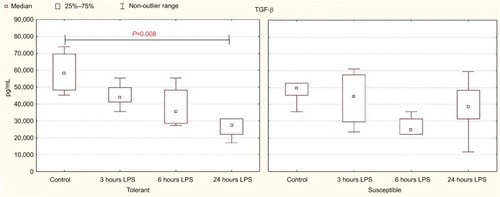
Figure 6 Morphological changes in the lungs of male Wistar rats tolerant and susceptible to hypoxia after 3, 6 and 24 hours of LPS administration.
Notes: H&E staining. Original magnification: (A–H) 640×. (A) Rats tolerant to hypoxia, control group – few neutrophils in the field of view. (B) Rats susceptible to hypoxia, control group – few neutrophils in the field of view. (C) Rats tolerant to hypoxia, 3 hours LPS – thickened interalveolar septa with neutrophils, hyperemia. (D) Rats susceptible to hypoxia, 3 hours LPS – pronounced neutrophil infiltration in interalveolar septa, hyperemia. (E) Rats tolerant to hypoxia, 6 hours LPS – neutrophil infiltration in interalveolar septa, hyperemia. (F) Rats susceptible to hypoxia, 6 hours LPS – high number of neutrophils in interalveolar septa, hyperemia. (G) Rats tolerant to hypoxia, 24 hours LPS – interalveolar septa with neutrophils, hyperemia. (H) Rats susceptible to hypoxia, 24 hours LPS – interalveolar septa with neutrophils, hyperemia.
Abbreviation: LPS, lipopolysaccharide.
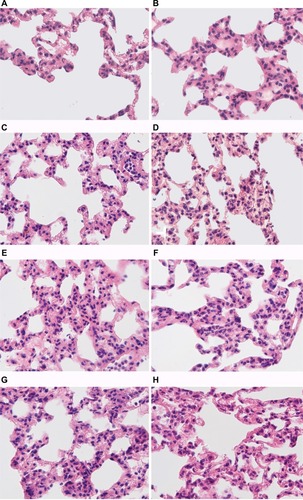
Figure 7 The average number of neutrophils counted in ten high-power fields of view (25,000 µm2) per section in the interalveolar septa of the lungs of rats tolerant and susceptible to hypoxia after 3, 6 and 24 hours of LPS administration (Me; 25%–75%).
Notes: In all groups there were 5 observations except the tolerant group after 24 hours of LPS injection, in which were 8. Statistical significance of differences (P-value) is determined by the Kruskal–Wallis method.
Abbreviation: LPS, lipopolysaccharide.
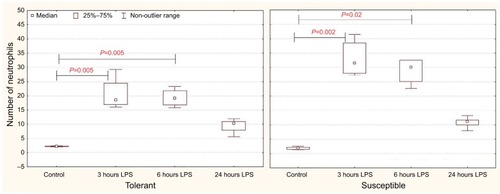
Table 5 summary of results