
Figures & data
Table 1 Primers used in this study
Figure 1 Macroscopic examinations of colon tissue in the UC and control groups. (A) Gross macroscopic structure of colon in control and UC Groups. (B) Weight to length ratio of the last 6 cm of colon tissue. The induction of colitis model was performed once. Each column represents fold change±SEM for six male Wistar rats. * P≤0.05.
Abbreviation: UC, ulcerative colitis.
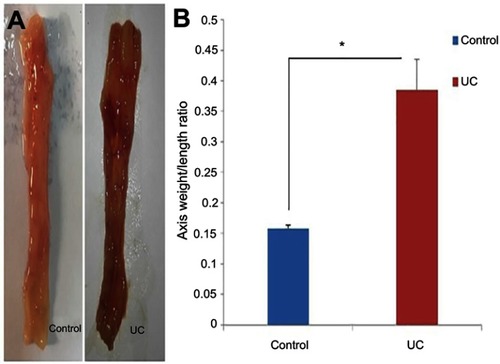
Figure 2 Histopathological findings of UC and control groups. The experiments were performed using optical microscopy with 10X and 40X magnification. (A&B) Normal colon, (C&D) UC.
Abbreviation: UC, ulcerative colitis.
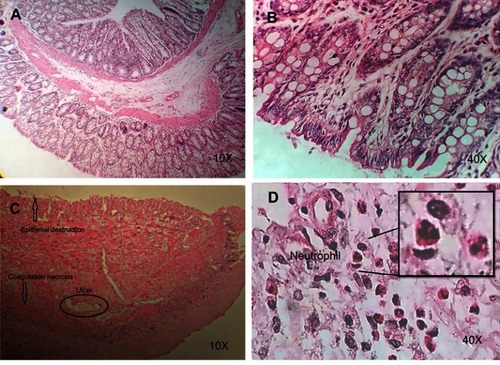
Figure 3 ELR+ CXC chemokines are highly upregulated in UC. Each column represents a fold change ± SEM for six male Wistar rats. Fold change calculated using this formula: 2−ΔCT[2 − (CT CXCL – CT GAPDH)] UC group/2−ΔCT[2 − (CT CXCL – CT GAPDH)] control. The statistical results in the UC group show a significant difference compared to the control. * P≤0.05, ** P≤0.01, *** P<0.0001.
Abbreviation: UC, ulcerative colitis.
![Figure 3 ELR+ CXC chemokines are highly upregulated in UC. Each column represents a fold change ± SEM for six male Wistar rats. Fold change calculated using this formula: 2−ΔCT[2 − (CT CXCL – CT GAPDH)] UC group/2−ΔCT[2 − (CT CXCL – CT GAPDH)] control. The statistical results in the UC group show a significant difference compared to the control. * P≤0.05, ** P≤0.01, *** P<0.0001.Abbreviation: UC, ulcerative colitis.](/cms/asset/75b484f5-759e-4951-a063-56de0aaff3b8/djir_a_12198444_f0003_c.jpg)
Figure 4 Expression comparison of ELR− CXC chemokines in AA-induced UC. Each column represents fold change ± SEM for six male Wistar rats. Fold change calculated using this formula: 2−ΔCT[2 − (CT CXCL – CT GAPDH)] UC group/2−ΔCT[2 − (CT CXCL – CT GAPDH)] control. The statistical results of CXCL4, CXCL13, CXCL14, and CXCL16 chemokines in UC group had a significant difference with the control group (P≤0.05). The statistical results of CXCL9, CXCL10, CXCL11, CXCL12 and CXCL17 chemokines in UC group showed no significant difference with control group (P>0.05). ** P≤0.01, *** P<0.0001.
Abbreviation: UC, ulcerative colitis.
![Figure 4 Expression comparison of ELR− CXC chemokines in AA-induced UC. Each column represents fold change ± SEM for six male Wistar rats. Fold change calculated using this formula: 2−ΔCT[2 − (CT CXCL – CT GAPDH)] UC group/2−ΔCT[2 − (CT CXCL – CT GAPDH)] control. The statistical results of CXCL4, CXCL13, CXCL14, and CXCL16 chemokines in UC group had a significant difference with the control group (P≤0.05). The statistical results of CXCL9, CXCL10, CXCL11, CXCL12 and CXCL17 chemokines in UC group showed no significant difference with control group (P>0.05). ** P≤0.01, *** P<0.0001.Abbreviation: UC, ulcerative colitis.](/cms/asset/59e4b26e-d80b-499c-b6e1-2ff17f8594a6/djir_a_12198444_f0004_c.jpg)