Figures & data
Figure 1 Chromatogram of Myricetin and Quercetin by HPLC at 255 nm wavelength.
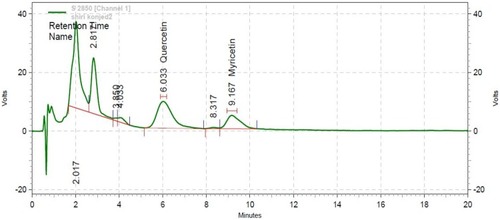
Figure 2 Chromatogram of Safranal and Crocin by HPLC at 255 nm wavelength.
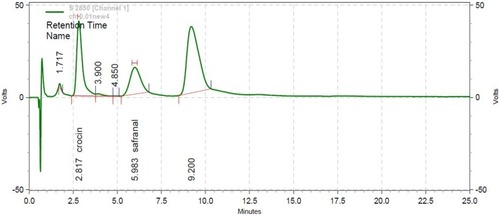
Table 1 Comparison of the mean serum concentrations of the inflammatory indices in the beginning and end of the study in various groups
Figure 3 Comparison of the serum concentrations of the inflammatory indices in various groups in contrast to the negative control group. (*P<0.05, **P<0.01, ***P<0.001).
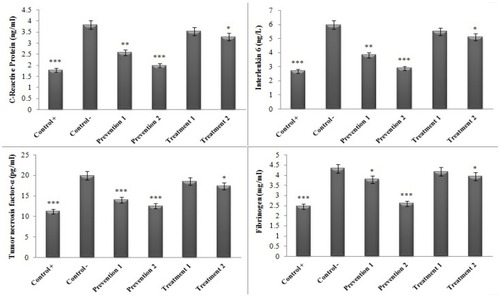
Table 2 Comparison of the serum concentrations of hepatic enzymes in various groups at the beginning and end of the study
Figure 4 Comparison of the serum concentrations of the hepatic enzymes in various groups in contrast to the negative control group. (*P<0.05, **P<0.01, ***P<0.001).
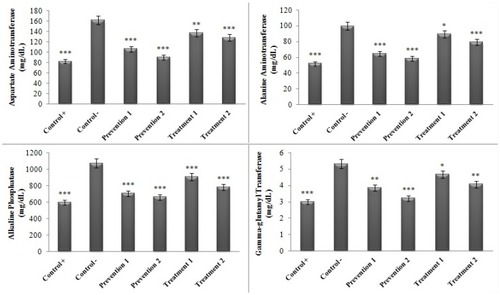
Table 3 Comparison of the serum concentrations of renal enzymes in various groups at the beginning and end of the study
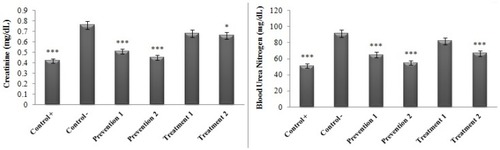
Figure 5 Comparison of the serum concentrations of the renal enzymes in various groups in contrast to the negative control group. *P<0.05, ***P<0.001.