Figures & data
Figure 1 Body weights of KAD rats in the CON, DSS, and DSS + MHO groups from 5 to 8 weeks of age. Values are expressed as mean ± standard deviation (n = 6). ap < 0.05 compared with the age-matched CON group.
Abbreviations: CON, control; DSS, dextran sulfate sodium; MHO, mild hyperbaric oxygen.
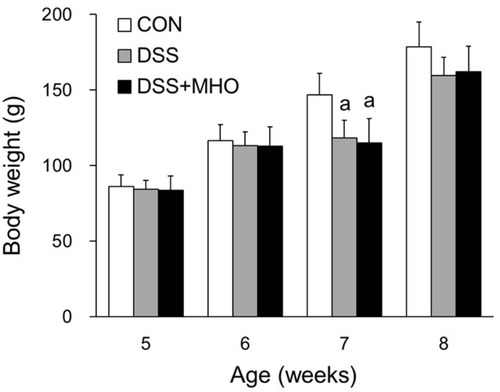
Figure 2 Incidences of diarrhea in DSS-induced KAD rats in the DSS and DSS + MHO groups from 6 to 8 weeks of age. Values are expressed as mean ± standard deviation (n = 6). bp < 0.05 compared with the age-matched DSS group.
Abbreviations: DSS, dextran sulfate sodium; MHO, mild hyperbaric oxygen.
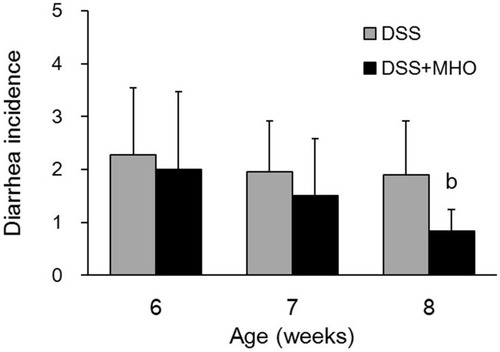
Figure 3 Macroscopic view of the distal colon in KAD rats in the CON (A), DSS (B), and DSS + MHO (C) groups at 8 weeks of age. The distal colon was cut longitudinally along the main axis. Scale bar indicates 1 cm.
Abbreviations: CON, control; DSS, dextran sulfate sodium; MHO, mild hyperbaric oxygen.
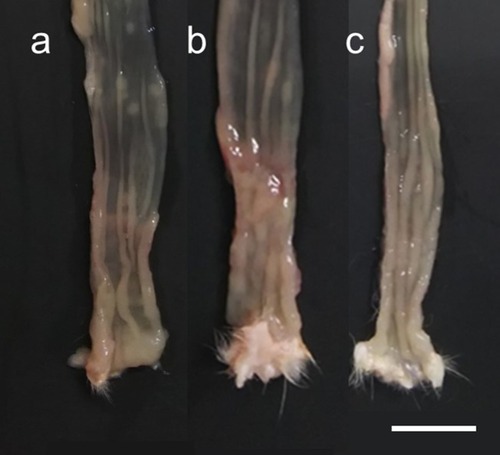
Figure 4 (A) Histology of the distal colon in KAD rats of the CON (a), DSS (b), and DSS + MHO (c) groups at 8 weeks of age. Hematoxylin-eosin staining was used. Scale bar on c indicates 100 μm. (B) Colonic inflammation scores in the DSS and DSS + MHO groups at 8 weeks of age. Values are expressed as mean ± standard deviation (n = 6).
Abbreviations: CON, control; DSS, dextran sulfate sodium; MHO, mild hyperbaric oxygen.
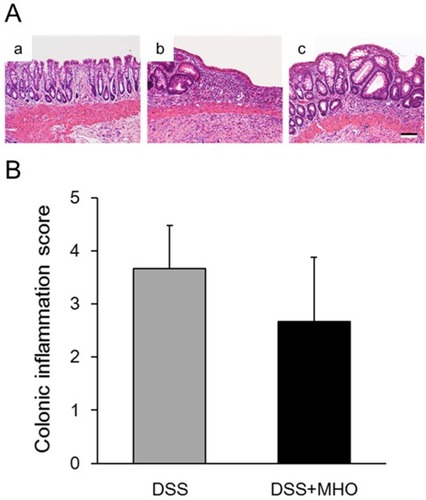
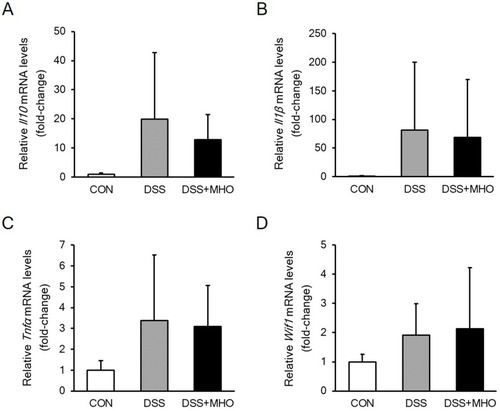
Figure 5 mRNA levels of Il10 (A), Il1β (B), Tnfα (C), and Wif1 (D) in the colonic mucosa of the distal colon in KAD rats in the CON, DSS, and DSS + MHO groups at 8 weeks of age. Values are expressed as mean ± standard deviation (n = 6).
Abbreviations: CON, control; DSS, dextran sulfate sodium; MHO, mild hyperbaric oxygen.