Figures & data
Table 1 Demographic, Clinical and Laboratory Features of RA Subjects and HCs
Figure 1 ELISA-based analysis of antibody reactivity against two proteins of MAP in RA subject and HCs. The sera was tested against plate-coated PtpA (A) and PknG (B) proteins. Bars represent the median ± interquartile range. Thresholds for antibody positivity are indicated by dashed lines. P-values are indicated above the distributions. ROC analysis of both proteins (C and D).
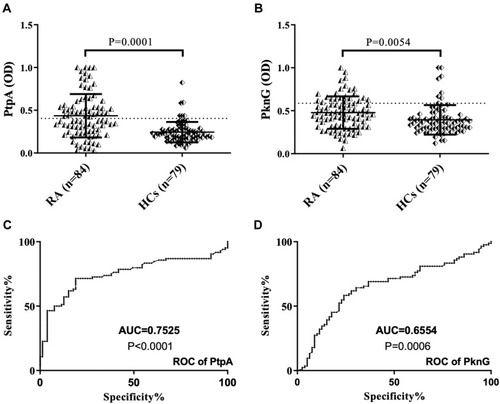
Figure 2 Scatter plot showing correlations between Abs titers recognizing (A) BOLF1305–320 and PtpA, (C) MAP_402718–32 and PtpA, (E) IRF5424–434 and PtpA, (B) BOLF1305–320 and PknG, (D) MAP_402718–32 and PknG, (F) IRF5424–434 and PknG in 84 RA patients and 79 HCs. Person’s correlation was calculated through Graphpad Prism 6.0 software.
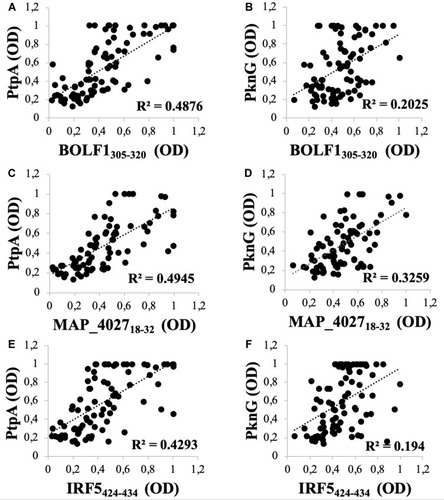
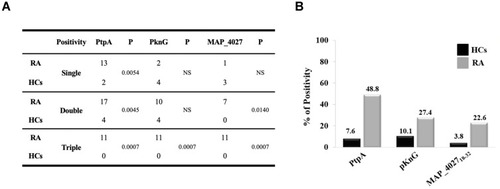
Figure 3 (A) Coincidence of seroreactivity to the PtpA, PknG proteins and MAP_402718–32 peptide among Abs-positive RA and HCs subject. (B) Prevalence of Abs directed against PtpA, PknG and MAP_402718–32 in RA patients and HCs.