Figures & data
Figure 1 Simulation of blood concentrations in comparison vs. IV infliximab 3 mg/kg expressed as trough concentration, or Ctrough, broken down by body weight bands. Summary Forest Plots of log transformed Ctrough GMRs (90% CIs) for the Simulated CT-P13 SC 120 mg Q2W Maintenance Dosing Regimen vs. CT-P13 IV 3 mg/kg Q8W Maintenance Reference Treatment by weight bands.
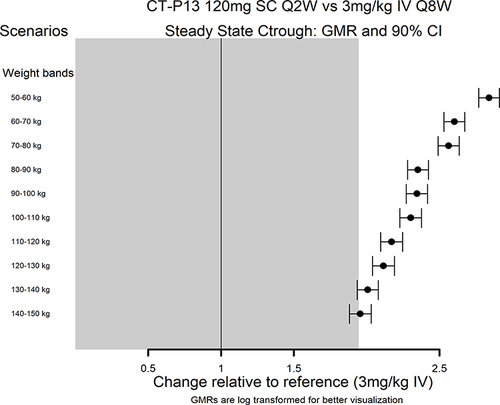
Figure 2 Simulation of blood concentrations in comparison vs. IV infliximab 5 mg/kg expressed as trough concentration, or Ctrough, broken down by body weight bands. Boxplot of Ctrough,ss Obtained Following 120 mg Q2W SC and 5 mg/kg Q8W IV Maintenance Dosing Regimens for NAB- subjects.
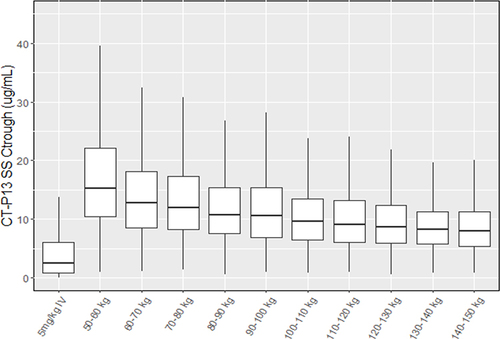
Figure 3 Design of part 2 of study CT-P13 3.5, a randomized, active-controlled, double-dummy, parallel groups, non-inferiority trial. The primary endpoint was measured during the double-blind and double-dummy phase at week 22, after which all patients switched to open-label SC formulation.
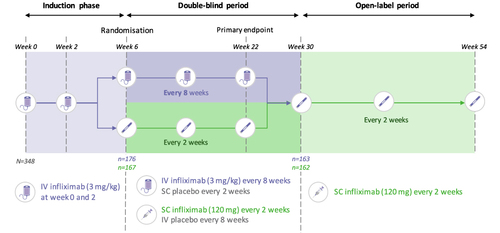
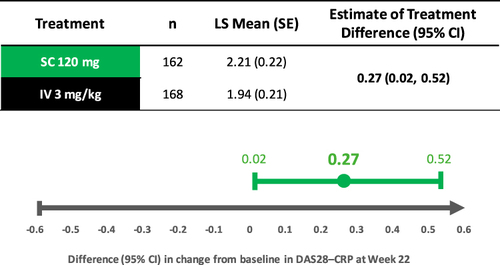
Figure 4 Primary endpoint results of part 2 of study CT-P13 3.5, analysis of change from baseline of DAS28 (CRP) at Week 22 (ANCOVA).