Figures & data
Table 1 Clinical and metabolic characteristics and dietary intake by rs7801406 genotypeTable Footnote*
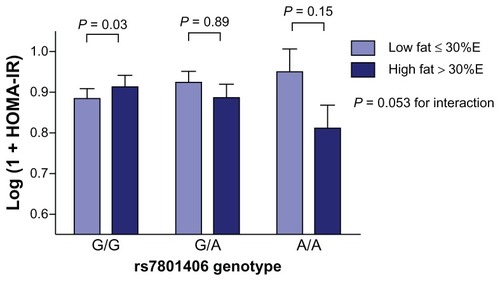
Figure 1 Interaction between dietary fat, the rs7801406 polymorphism, and HOMAIR levels.
Notes: Values are means ± standard error of the mean adjusted for total: HDL cholesterol ratio, plasma triglycerides, waist circumference, and ethnocultural group. Dietary fat was inversely related to HOMA-IR in A/A carriers (β = −0.012 ± 0.006, P = 0.047) and positively among G/G homozygotes (β = 0.005 ± 0.002, P = 0.03). This relationship (in the G/G carriers) was significantly different from the A/A homozygotes (P = 0.02).
Abbreviations: HDL, high-density lipoprotein; HOMA-IR, homeostasis model assessment of insulin resistance.
Abbreviations: HDL, high-density lipoprotein; HOMA-IR, homeostasis model assessment of insulin resistance.