Figures & data
Figure 1 Proposed cellular mechanism for Niacin-induced prostaglandins formation.
Notes: Niacin binding to its receptor, GPR109A, causes influx of calcium (Ca2+) through voltage gated channels. Ca2+ binds to cPLA2, which subsequently phosphorylated by cellular kinases and translocated to plasma membrane. Phospholipids containing AA, EPA, or DHA are degraded into free fatty acids by the action of cPLA2. COX-1 and -2 catalyze oxygenation of AA into 2-series PG and TXA and oxygenation of EPA into 3-series PGs and TXA. DHA is not a substrate for COX-1; however, in endothelial cells COX-2 enzymes convert EPA and DHA into hydroxy fatty acids in the presence of aspirin. These are released from the endothelium and are rapidly converted by 5-LOX in adherent leukocytes into bioactive compounds termed as resolvins (resolution phase interaction product). Resolvins derived from EPA are designated as E series (RvE) and those derived from DHA are termed as D series.
Abbreviations: 5-lipooxygenase, 5-LOX; AA, arachidonic acid; COX-1 and-2, Cyclooxygenase-1 and-2; cPLA2, cytosolic phospholipase A2; DHA, docosahexaenoic acid; EPA, eicosapentaenoic acid; PG, prostaglandins; TXA, thromboxanes.
Abbreviations: 5-lipooxygenase, 5-LOX; AA, arachidonic acid; COX-1 and-2, Cyclooxygenase-1 and-2; cPLA2, cytosolic phospholipase A2; DHA, docosahexaenoic acid; EPA, eicosapentaenoic acid; PG, prostaglandins; TXA, thromboxanes.
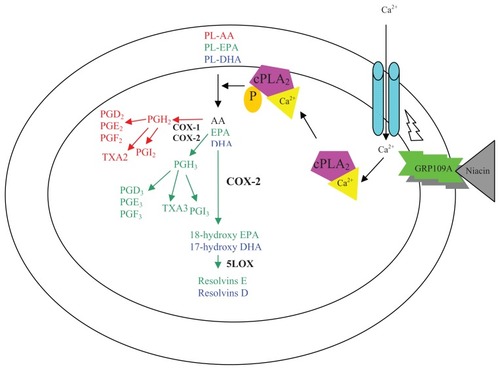
Figure 2 Effect of fatty acids on niacin induced PGD2 secretion in THP-1 macrophages.
Notes: THP-1 macrophages were incubated with 50 and 75 μM (A) DHA, (B) EPA, or (C) OLA for 24 hours before being exposed to varying concentrations of niacin for 30 minutes. Concentration of PGD2 in the medium was determined using an EIA kit as per manufacturer’s instructions (Cayman Chemical, Ann Arbor, MI). Values are the means ± the standard deviations of duplicate experiments.
Abbreviations: DHA, docosahexaenoic acid; EIA, enzyme immunoassay; EPA, eicosapentaenoic acid; PGD2, prostaglandin D2; OLA, oleic acid.
Abbreviations: DHA, docosahexaenoic acid; EIA, enzyme immunoassay; EPA, eicosapentaenoic acid; PGD2, prostaglandin D2; OLA, oleic acid.
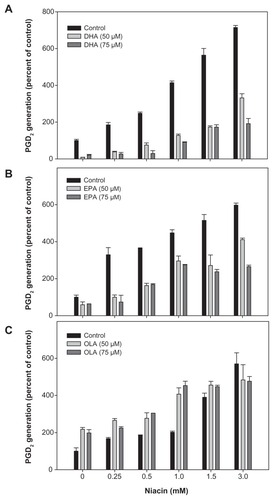
Figure 3 Effect of fatty acids on niacin induced PGE2 secretion in THP-1 macrophages.
Notes: THP-1 macrophages were incubated with 50 and 75 μM (A) DHA, (B) EPA, and (C) OLA for 24 hours before being exposed to varying concentrations of niacin for 30 minutes. Concentration of PGE2 in the medium was determined using an EIA kit as per manufacturer’s instructions (Cayman Chemical, Ann Arbor, MI). Values are the means ± the standard deviations of duplicate experiments.
Abbreviations: DHA, docosahexaenoic acid; EIA, enzyme immunoassay; EPA, eicosapentaenoic acid; PGD2, prostaglandin D2; OLA, oleic acid.
Abbreviations: DHA, docosahexaenoic acid; EIA, enzyme immunoassay; EPA, eicosapentaenoic acid; PGD2, prostaglandin D2; OLA, oleic acid.
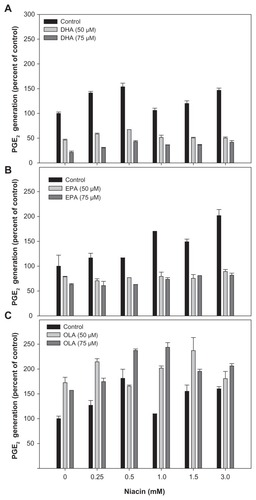
Figure 4 Fatty acid incorporation into phospholipids of THP-1 macrophages.
Notes: THP-1 macrophages were treated with increasing concentrations of (A) DHA, (B) EPA or (C) OLA for 24 hours. Lipids were isolated and fatty acid concentrations were determined by gas chromatography as described in the text.
Notes: Values are the mean ± the standard deviation of triplicates. Results are analyzed using Student’s t test. *P < 0.01 compared to non-supplemented cells.
Abbreviations: AA, arachidonic acid; DHA, docosahexaenoic acid; EPA, eicosapentaenoic acid; PGD2, prostaglandin D2; OLA, oleic acid.
Notes: Values are the mean ± the standard deviation of triplicates. Results are analyzed using Student’s t test. *P < 0.01 compared to non-supplemented cells.
Abbreviations: AA, arachidonic acid; DHA, docosahexaenoic acid; EPA, eicosapentaenoic acid; PGD2, prostaglandin D2; OLA, oleic acid.
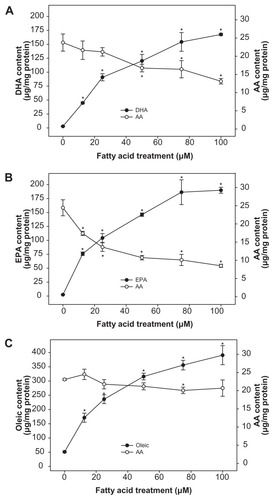
Figure 5 Effect of fatty acids on GPR109A niacin receptor expression in THP-1 macrophages.
Notes: Macrophages were treated with 50 or 75 μM DHA, EPA, and OLA for 24 hours prior to stimulation with niacin (30 minutes). Cells were labeled with phycoerythrin-conjugated GPR109A and expression of GPR109A was determined using a FACSCalibur flow cytometer as described in the text. (A) Filled histograms represent the isotype control and open histograms represent GPR109A. Data is representative of the 75 μM treatments. (B) Data were quantified as the percent change of mean fluorescent intensity. Values are the means ± the standard deviations of three independent duplicate experiments. Results are analyzed using ANOVA, followed by pair-wise comparisons with the Bonferroni adjustment. *P < 0.01 compared to niacin treatment controls.
Abbreviations: AA, arachidonic acid; DHA, docosahexaenoic acid; EPA, eicosapentaenoic acid; PGD2, prostaglandin D2; OLA, oleic acid.
Abbreviations: AA, arachidonic acid; DHA, docosahexaenoic acid; EPA, eicosapentaenoic acid; PGD2, prostaglandin D2; OLA, oleic acid.
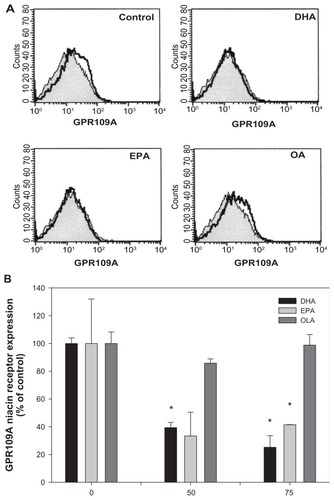
Figure 6 Effect of fatty acids on calcium mobilization in THP-1 macrophages.
Notes: Macrophages were treated with 50 μM DHA, EPA, and OLA for 24 hours. Cells were labeled with Fura 2-AM, and the change in ratio of fluorescence intensity at 340/380 (R) was monitored as described in the text. Results show a representation from three experiments.
Abbreviations: DHA, docosahexaenoic acid; EPA, eicosapentaenoic acid; OLA, oleic acid.
Abbreviations: DHA, docosahexaenoic acid; EPA, eicosapentaenoic acid; OLA, oleic acid.
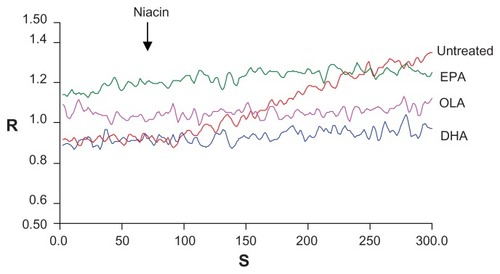
Figure 7 Niacin induces cPLA2 activation in THP-1 macrophages.
Notes: Macrophages were treated with 1.5 or 3 mM niacin at three time points. (A) Western blot analysis was used to determine expression of phosphorylated cPLA2 as described in the text. (B) Data is the densitometry analysis of bands and reported as the mean ± SD of ratios of cPLA2/GAPDH of at least three determinations. Results are analyzed using ANOVA, followed by pair-wise comparisons with the Bonferroni adjustment. *P < 0.01 compared to niacin treatment controls.
Abbreviations: cPLA2, cytosolic phospholipase A2.
Abbreviations: cPLA2, cytosolic phospholipase A2.
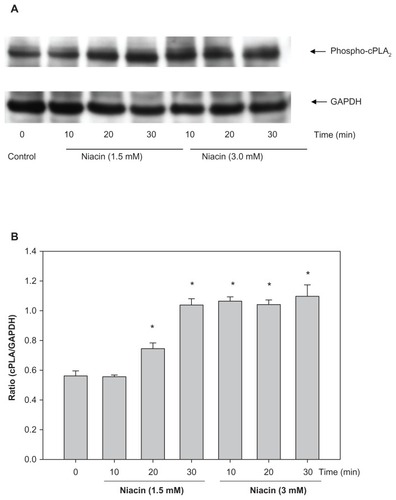
Table 1 Effect of fatty acids on COX-1 activity in THP-1 macrophages
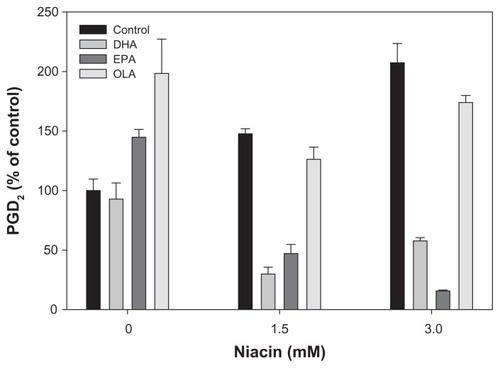
Figure 8 Effect of fatty acids on niacin-induced PGD2 secretion in Langerhans cells.
Notes: Langerhans cells were treated with 50 μM fatty acids for 24 hours before a 30 minute exposure to 1.5 or 3 mM niacin. Concentrations of PGD2 in the medium were determined using an EIA kit as per manufacturer’s instructions (Cayman Chemical, Ann Arbor, MI). Values are the means ± the standard deviations of triplicate experiments from one preparation of Langerhans cells.
Abbreviations: EIA, enzyme immunoassay.
Abbreviations: EIA, enzyme immunoassay.