Figures & data
Figure 1 Panoramic radiograph at first visit, showing a ground-glass appearance (yellow arrows) from the left premolar to the mandibular ramus region and enlarged canals of the left mandible (red arrow).
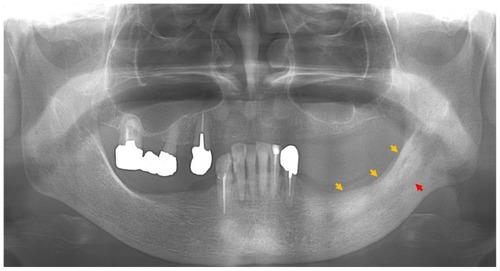
Figure 2 Plain computed tomography at first visit revealed increased density of cancellous bone.
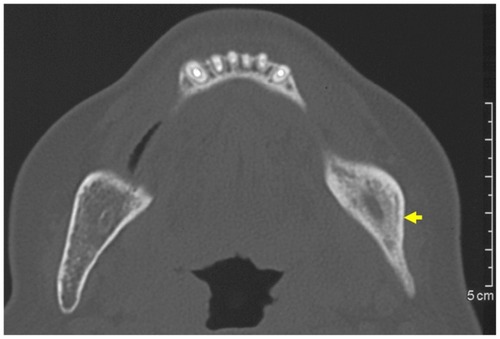
Figure 3 Magnetic resonance imaging at first visit.
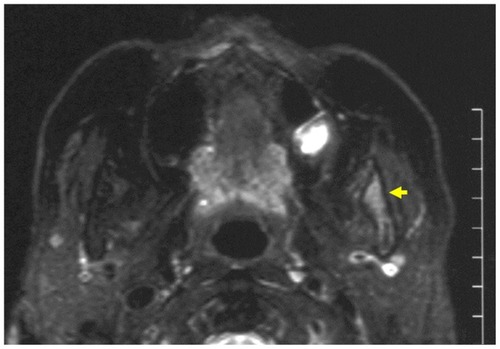
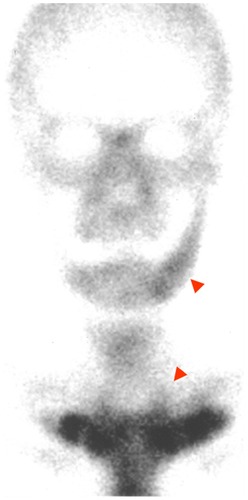
Figure 4 Bone scintigram (99mTc-labeled methylene diphosphonate) at first visit, showing extremely intense tracer uptake in the left side of the mandible, the sternum, and the sternocostal and sternoclavicular joints.
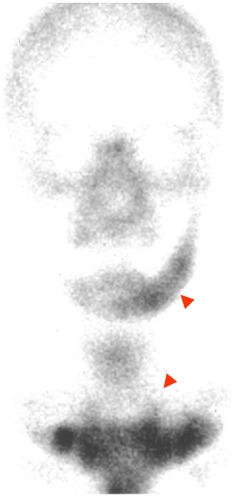
Figure 5 CT and MRI at 4-month follow-up after the first visit: (A) plain CT showing diffuse cortical bone resorption of the left condyle of the mandible; (B) MRI, with the left condyle of the mandible in part showing low-high signal intensity on a T1-weighted image; (C) MRI, with soft tissue around the left side of the ascending ramus of the mandible showing heterogeneous high-signal intensity on a fat-suppressed T2-weighted image.
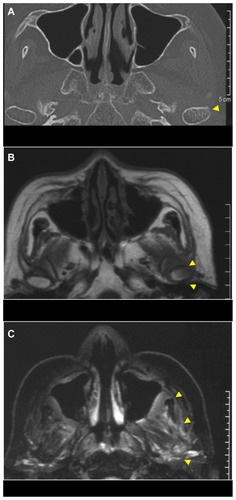
Figure 6 Bone scintigram 6 months after administration of antibiotics.