Figures & data
Figure 1 Serum hemolytic complement activity (CH50) of rats undergoing various clinically relevant experimental procedures. Displayed are mean values of CH50 data during the time course of the experiments compared to the control.
Abbreviations: CLP, cecal ligation and puncture; I/R, ischemia/reperfusion; LPS, lipopolysaccharide.
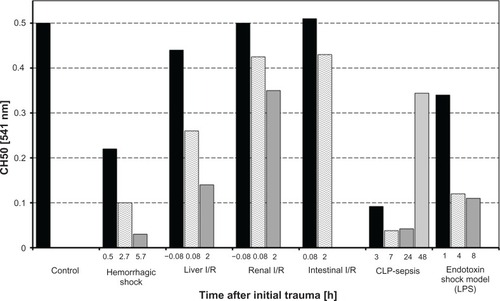
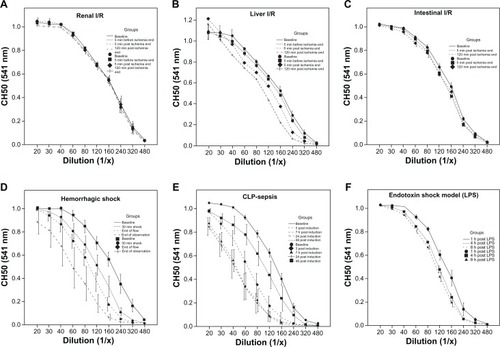
Figure 2 Time courses of serum hemolytic complement activity (CH50) of rats subjected to various diseases.
Note: Displayed are means +/− SEM.
Abbreviations: CLP, cecal ligation and puncture; I/R, ischemia/reperfusion; LPS, lipopolysaccharide.
Abbreviations: CLP, cecal ligation and puncture; I/R, ischemia/reperfusion; LPS, lipopolysaccharide.