Figures & data
Figure 1 Cu-Zn superoxide dismutase (SOD1) activity in heart tissues of two SOD1 transgenic (tg) strains and their littermates.
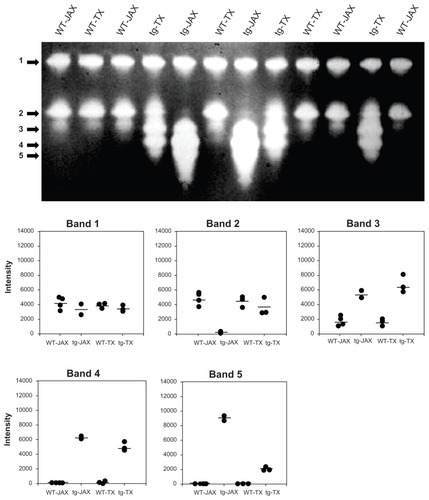
Figure 2 Cu-Zn superoxide dismutase (SOD1) activity in liver tissues of two SOD1 transgenic (tg) strains and their littermates.
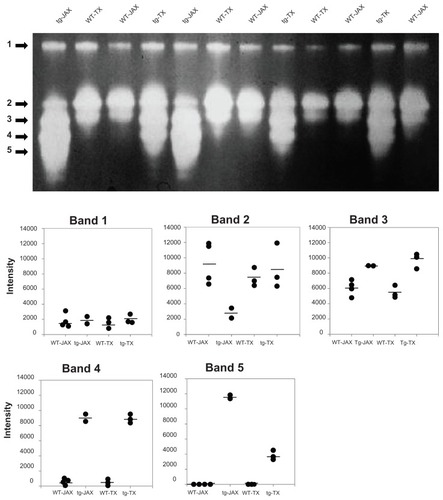
Figure 3 Cu-Zn superoxide dismutase (SOD1) activity in intestinal tissues of two SOD1 transgenic (tg) strains and their littermates.
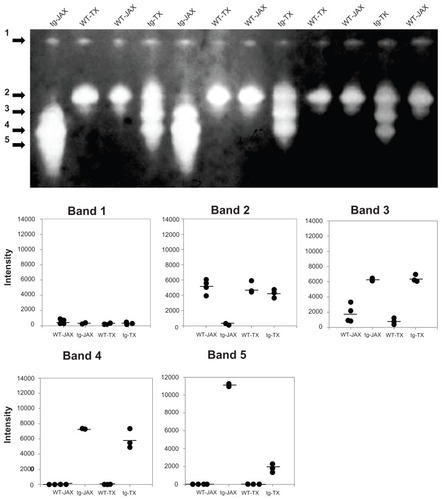
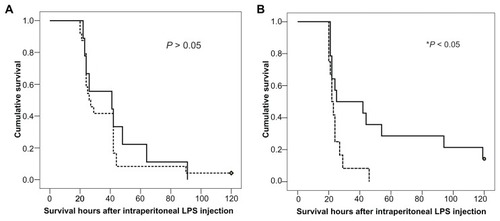
Figure 4 Survival analyses of two Cu-Zn superoxide dismutase (SOD1) transgenic (tg) strains after endotoxic shock. SOD1 tg and wild-type (WT) mice were subjected to intraperitoneal injection of LPS. (A) Survival curves for tg-JAX mice (solid line) and their WT littermates (dotted line). The diamond represents censored data. (B) Survival curves for tg-TX mice (solid line) and their WT litermates (dotted line).