Figures & data
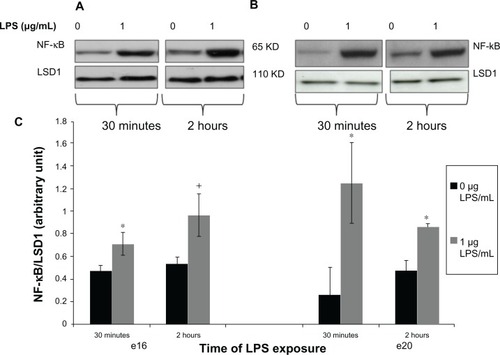
Figure 1 Fold change of pro-inflammatory cytokine interleukin (IL)-6 and tumor necrosis factor alpha (TNFα) released from preterm (e16) and near-term (e20) placental explants following lipopolysaccharide (LPS) treatments. Explants were incubated with increasing concentrations of LPS (0 μg/mL, 1 μg/mL and 10 μg/mL) for 6 hours. Enzyme-linked immunosorbent assay kits were used to determine supernatant levels of the cytokines IL-6 and TNFα. Explants exposed to 1 μg/mL and 10 μg/mL LPS (A) demonstrated a significant release in IL-6. *P < 0.05 versus vehicle. Preterm (e16) LPS treated explants had higher IL-6 induction than e20 treated explants. +P < 0.05 versus e20 at each matched dose (1 and 10 μg/mL). Also explants exposed to either 1 μg/mL or 10 μg/mL LPS (B) demonstrated a significant release in TNFα. *P < 0.05 versus vehicle. Preterm (e16) LPS treated explants had higher TNFα induction than e20 treated explants. +P < 0.05 versus e20 at each matched dose (1 and 10 μg/mL).
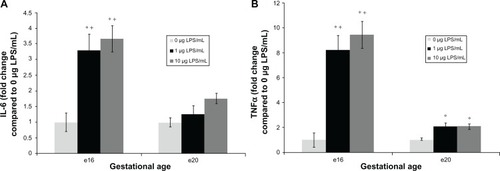
Figure 2 Toll-like receptor 4 expression from preterm (e16) and near-term (e20) placental explant protein lysates following LPS treatments. Explants were incubated with or without LPS (0 μg/mL and 1 μg/mL) for 6 hours. Western blot (A and B) and densitometric analysis (C) showed that TLR4 protein expression was unaffected by LPS exposure at both gestational ages. P = 0.85 (e16) and p = 0.87 (e20) vs vehicle (0 μg/mL).
Abbreviations: LPS, lipopolysaccharide; TLR, toll-like receptor.
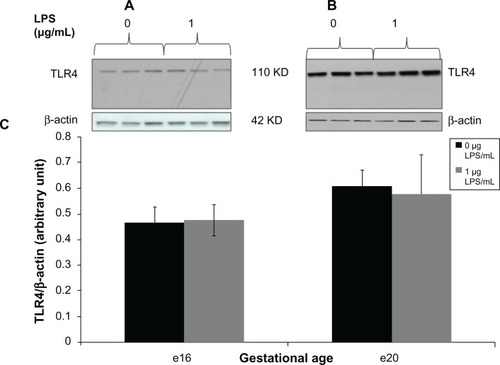
Figure 3 Phosphorylated nuclear NF-kB protein expression from preterm (e16) and near-term (e20) placental explants following LPS treatments. Explants were incubated with or without LPS (0 μg/mL and 1 μg/mL) for 30 minutes and 2 hours. Western blot (A and B) and densitometric analysis (C) showed that phosphorylated nuclear NF-κB was significantly increased in both e16 and e20 after exposure to LPS. +P = 0.064 vs untreated controls (0 μg/mL) (e16), and *P < 0.05 versus vehicle (0 μg/mL) (e16 and e20).
Abbreviations: NF-κB, nuclear factor kappa-light-chain-enhancer of activated B cells; LPS, lipopolysaccharide.