Figures & data
Figure 1 Flow chart of eRNA identification.
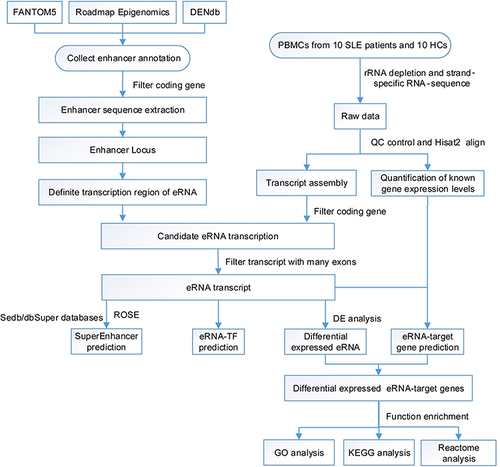
Figure 2 Expression landscape of eRNAs in PBMCs from healthy controls (HCs) and patients with systemic lupus erythematosus (SLE). (A) Distribution of eRNAs in the chromosomes of HCs, active SLE patients (SAG group), and stable SLE patients (SSG group). The outer circle is a chromosome positional map, and the numbers outside the circle indicate the chromosome numbers. Different colors are used to distinguish different chromosomes. Tick marks indicate chromosome coordinates. Unit are in millions. The inner circle indicates the circular RNA density of each coordinate interval in the chromosomes. Data are shown as a scatter plot, with each point representing a coordinate interval in the chromosome, and values decrease from the outside to the inside. (B) Mean eRNA expression in chromosomes of the HC, SAG, and SSG groups. The lower and upper hinges correspond to the 25th and 75th percentiles. The upper whisker extends from the hinge to the largest value no further than 1.5 * IQR from the hinge. The lower whisker extends from the hinge to the smallest value at most 1.5 * IQR of the hinge (where IQR is the inter-quartile range, or distance between the first and third quartiles). Outliers are plotted individually. (C) Numbers of eRNAs in the HC, SAG, and SSG groups. Each dot represents an individual sample. (D) Total mean eRNA expression in the HC, SSG, and SAG groups. Each dot represents an individual sample. *P < 0.05; ns, no statistical significance. (E) Expression profile of eRNA in human PBMCs. Blue, yellow, and green bars indicate ubiquitous, semi-ubiquitous, and unique eRNAs, respectively. Purple, red, and blue-green bars denote the HC, SAG, and SSG groups, respectively. The red color gradient represents the eRNA expression level (in FPKM).
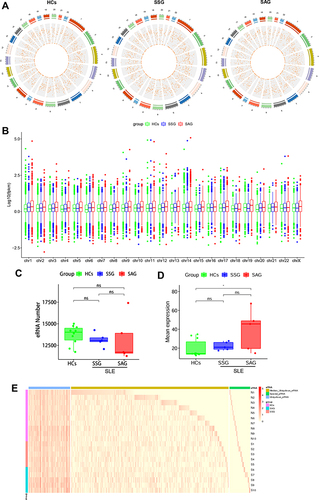
Figure 3 Putative regulation of eRNA biogenesis in SLE PBMCs. (A) Putative regulators of eRNAs in SLE PBMCs. Each dot represents one transcription factor (TF). Red dots denote putative master TFs significantly correlated to ≥10% of individual eRNAs. The X-axis indicates the chromosomes and the y-axis the percentage of eRNAs correlated to each TF. (B) Gene Ontology (GO) analysis of putative SLE-related master TFs. Biological processes are indicated in red, cellular components in Orange, and molecular functions in black. (C) KEGG pathway analysis of putative SLE-related master TFs. The Y-axis indicates pathway names and the X-axis the richness factor.
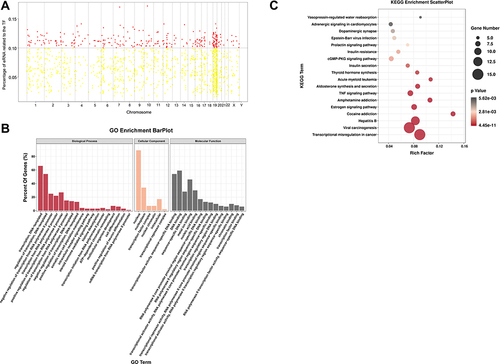
Figure 4 Differentially expressed eRNAs in PBMCs from HCs and SLE patients. (A and B) Venn diagram showing the overlap between significantly differentially expressed eRNAs in PBMCs of SLE patients (SAG and SSG) vs HCs, SAG vs HCs, and SSG vs HCs. (C and D) Hierarchical clustering of the 13 commonly upregulated and 23 commonly downregulated eRNAs. Red represents relatively high expression and green relatively low expression.
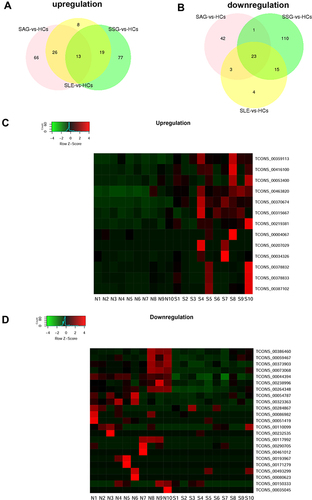
Figure 5 Expression of candidate SLE-related upregulated eRNAs. (A) Expression of three selected eRNAs in a validation cohort comprising six SLE patients and six HCs as indicated by RT-qPCR. The three eRNAs were selected for analysis in a larger validation cohort. Data are presented as 2−ΔCt relative to GAPDH expression (mean ± SEM). (B) Expression of TCONS_00034326 in a large validation cohort comprising 25 SLE patients and 20 HCs. One outlier in the SLE group was excluded. *P < 0.05. (C) ROC curve of TCONS_00034326 in the large validation cohort for SLE diagnosis.
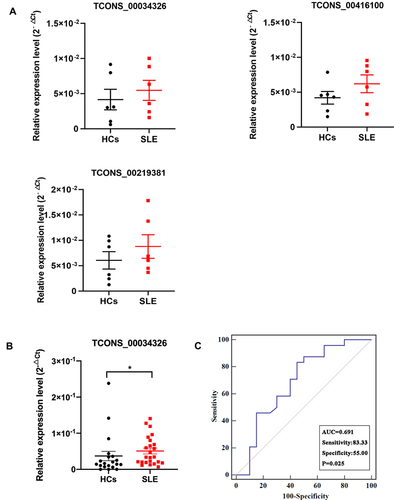
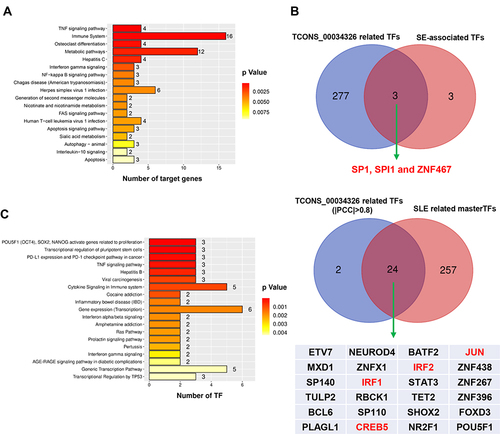
Figure 6 Putative regulation and regulatory network of eRNA biogenesis in SLE. (A). Putative regulatory pathways of TCONS_00034326 target genes in SLE. Three well-known SLE-related pathways (TNF signaling, immune system and metabolic pathways, and NF-κB signaling) are detailed in Supplementary File, Table S8 and Figure S7. (B) Overlap of TCONS_00034326-related TFs and SE-associated TFs (upper panel) and of TCONS_00034326-related TFs and SLE-related master TFs (lower panel). (C) Putative regulatory pathways of 24 TCONS_00034326-related master TFs in SLE. Three master TFs participate in TNF signaling, two master TFs are involved in interferon α/β and γ signaling (Supplementary File, Table S9).