Figures & data
Figure 1 Evaluation of the D-IBS rat model. (A) Body weight of rats after model establishment at various time points; rats were aged 1 day at the start of mother–infant separation, 22 days at the end mother–infant separation, 49 days at onset of restraint stress stimulation, and 59 days upon conclusion of restraint stress; (B) Comparison of fecal water content of rats after model establishment; (C) Comparison of AWR scores of rats after model establishment; (D) Comparison of EMG scores of rats in each group for different intracolonic pressures; (E) HE staining of colonic histopathology of rats. The measurement data is represented as mean ± standard deviation. Independent sample t-test was used to compare data between two groups while one-way analysis of variance with Tukey’s post-hoc test was used to compare data among multiple groups. Bonferroni-corrected repeated measures analysis of variance was used for comparison of data of different concentrations (doses). *p < 0.05, compared with the control group. N = 6 for rats in each group.
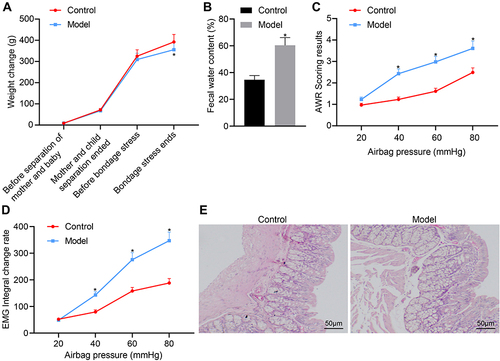
Figure 2 SAHA reduces the visceral sensitivity of D-IBS rats. (A) Comparison of fecal water content of rats after drug intervention; (B) Comparison of AWR scores of rats after drug intervention; (C) Comparison of EMG scores of rats in each group after drug intervention with different doses. The measurement data is represented as mean ± standard deviation. Independent sample t-test was used to compare data between two groups while one-way analysis of variance with Tukey’s post-hoc test was used to compare data among multiple groups. Bonferroni-corrected repeated measures analysis of variance was used for comparison of data of different concentrations (doses). *p < 0.05 compared with the control group. #p < 0.05 compared with the model group. N = 6 for rats in each group.
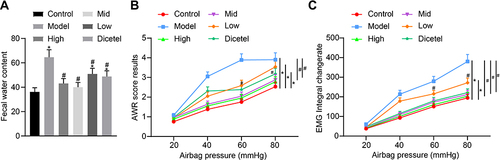
Figure 3 Effect of SAHA on the number of mast colonic cells and the expression of 5-HT signaling pathway-related markers in D-IBS model rats. (A) The number of mast cells in the colon tissues of rats detected by toluidine blue staining; (B) Determination of 5-HT content in the colon tissues of rats in each group by ELISA; (C) Determination of 5-HT content in the spinal cord tissues of rats in each group by ELISA; (D) mRNA expression of 5-HT3AR, 5-HT3BR, 5-HT4R, SERT and STAT3 in the colon tissues of rats in each group detected by qRT-PCR; (E) Expression of 5-HT3AR, 5-HT3BR, 5-HT4R, SERT, and STAT3, along with the phosphorylation level of STAT3 in the colon tissues of rats in each group detected by Western blot analysis; (F) Expression of 5-HT3AR and 5-HT3BR in the spinal cord tissues of rats in each group detected by Western blot analysis. The measurement data is represented as mean ± standard deviation. One-way analysis of variance with Tukey’s post-hoc test was used to compare data among multiple groups. *p < 0.05 compared with the control group; #p < 0.05 compared with the model group. N = 6 for rats in each group.
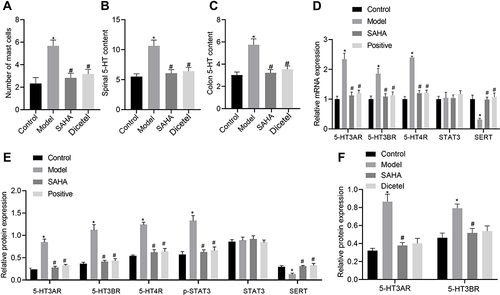
Figure 4 Activation of p-STAT3 reverses the inhibitory effect of SAHA on the visceral sensitivity in D-IBS model rats. (A) Mast cells in the colon tissues of rats in each group measured by toluidine blue staining; (B) Expression of 5-HT3AR, 5-HT3BR, 5-HT4R, STAT3 and SERT along with the phosphorylation level of STAT3 determined by Western blot analysis in the colon tissues of rats in each group. The measurement data is represented as mean ± standard deviation. One-way analysis of variance with Tukey’s post-hoc test was used to compare data among multiple groups. *p < 0.05 compared with the model group; #p < 0.05 compared with the SAHA group. N = 6 for rats in each group.
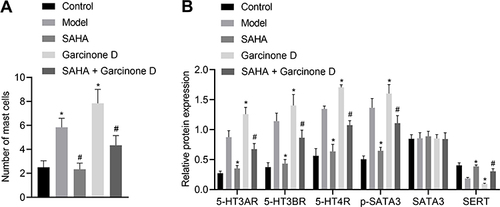
Figure 5 SAHA attenuates the visceral sensitivity of D-IBS rats through the STAT3/SERT/5-HT signaling pathway. (A) The transduction efficiency of sh-SERT was confirmed by qRT-PCR; (B) The expression of 5-HT3AR, 5-HT3BR, STAT3 and SERT along with the phosphorylation level of STAT3 in the colon tissues of rats in each group detected by Western blot analysis; (C) The number of mast cells in the colon tissues of rats in each group measured by toluidine blue staining; (D) Expression of tryptase-β in the colon mucosa by immunohistochemistry. The measurement data is represented as mean ± standard deviation. Independent sample t-test was used to compare data between two groups while one-way analysis of variance with Tukey’s post-hoc test was used to compare data among multiple groups. *p < 0.05 compared with the sh-NC group; #p < 0.05 compared with the SAHA group. N = 6 for rats in each group.
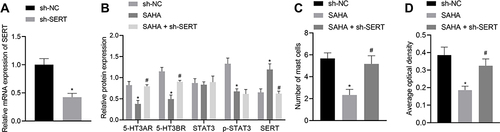
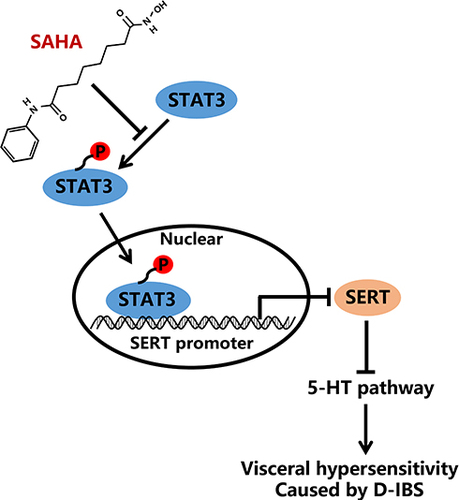
Figure 6 Schematic diagram of the mechanism by which SAHA affects the D-IBS via the STAT3/SERT/5-HT signaling axis. SAHA could promote the transcription of SERT by inhibiting STAT3 phosphorylation and the 5-HT signaling pathway, thereby repressing visceral sensitivity of D-IBS rats and consequently alleviating D-IBS.