Figures & data
Figure 1 Effects of YQHX on levels of blood glucose, insulin, and HOMA-IR. (A) Blood glucose; (B) insulin; (C) HOMA-IR. Error bars indicate mean ± SEM (n = 6). ▲P < 0.05 compared with the model group; *P<0.05 compared with the model group; ΔP<0.05 compared with the control group.
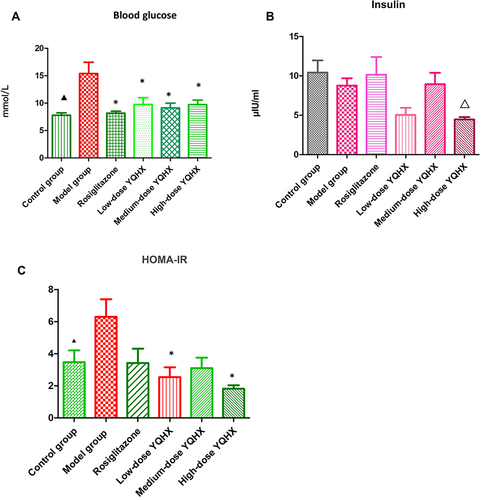
Figure 2 Effects of YQHX on levels of serum lipids. (A) TC; (B) TG; (C) LDL-C; (D) HDL-C. Error bars indicate mean ± SEM (n = 6). ▲P < 0.05 compared with the model group; *P < 0.05 compared with the model group.
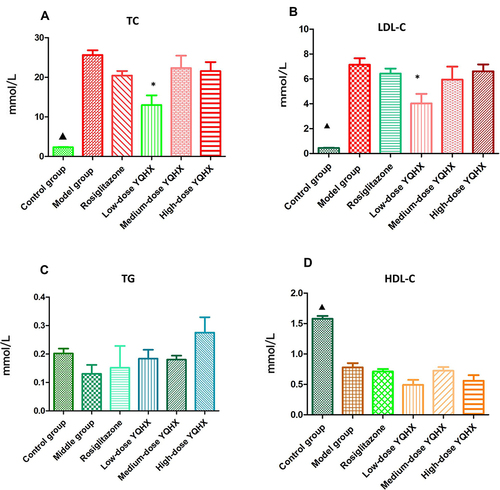
Figure 3 Effects of YQHX on expression of tumor necrosis factor (TNF)-α and interleukin (IL)-6. (A) TNF-ɑ; (B) IL-6. Error bars indicate mean ± SEM (n = 6). ▲P < 0.05 compared with the model group; *P<0.05 compared with the model group.
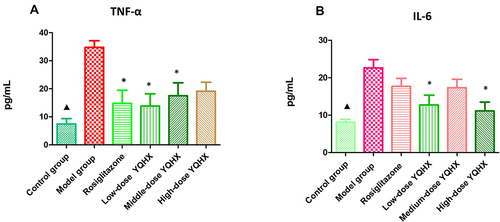
Figure 4 Pathologic staining of atherosclerotic lesions. (A) Whole aortic area by Oil red O staining; (B) percentage of lipid accumulation; (C) representative photographs of aortic lesions from H&E staining (magnification × 200); (D)percentage of plaque area. The error bars indicate mean ± SEM (n=3). ▲ P<0.05, compared with the model group; * P<0.05, compared with the model group.
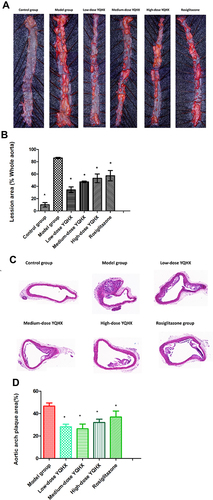
Figure 5 Differential methylation of six aorta samples from the model group versus those from the control group. (A) Volcano plot of methylation sites. Hypomethylated sites are blue and hypermethylated sites are red. Dotted lines delineate ±0.1 methylation differences and represent a threshold of 0.05 for P. (B) Distribution of differently methylated sites in the positions of genes in the model group compared with that in the control group. (C) Top-30 KEGG terms for aberrantly methylated genes in the model group.
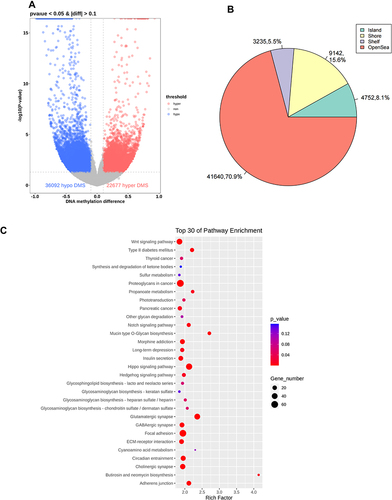
Figure 6 General information about YQHX effects on DNA methylation in mice with DA. Volcano plots of methylation for significant CpG sites. Hypomethylated probes are blue and hypermethylated probes are red. Dotted lines delimit ±0.1 methylation differences between YQHX-treated groups vs control group, and represent a P-value threshold of 0.05. Compared with those in the model group, differentially methylated sites are shown in the low- (A), medium- (B) and high-dose YQHX (C) groups, respectively. (D) Alluvial diagram showing the distribution of differentially methylated sites among different groups.
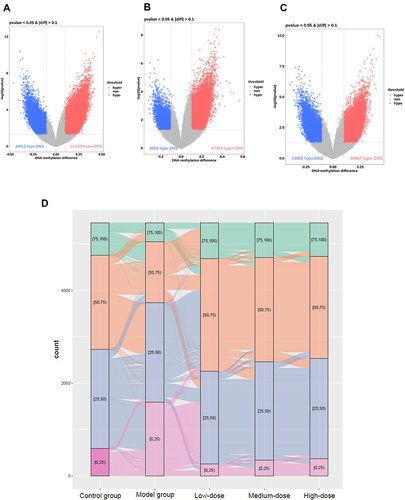
Table 1 KEGG Analysis of Identified Hypermethylated Genes from Low-Dose YQHX Group Comparing with Those in Model Group
Table 2 KEGG Analysis of Identified Hypermethylated Genes from Medium-Dose YQHX Group Comparing with Those in Model Group
Figure 7 Low-dose YQHX–DA PPI network analysis. Compared with those in the model group, the top-500 hypermethylated genes in the low-dose YQHX group were chosen for PPI network analysis using the STRING database. The size and color of the node represent the value of degree. The deeper the color, the higher the degree. The red nodes (Egfr, Pik3r1, Pxn) have higher degrees. The node size of genes is proportional to the number of degrees.
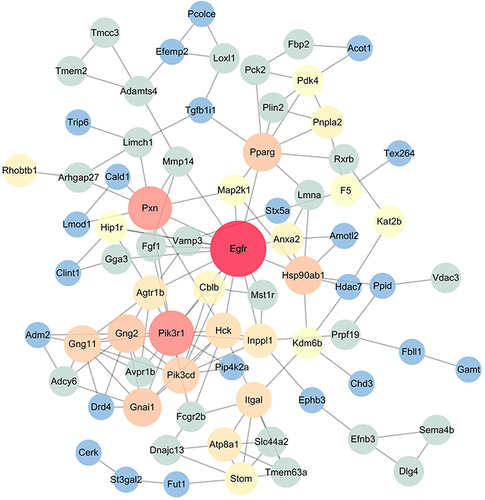
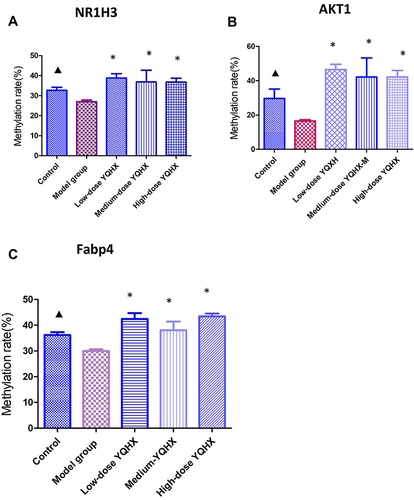
Figure 8 Effects of YQHX on methylation of NR1H3, AKT1, and Fabp4 according to pyrosequencing. (A) NR1H3; (B) AKT1; (C) Fabp4. Error bars indicate mean ± SEM (n = 6). ▲P < 0.05 compared with the model group; *P < 0.05, compared with the model group.