Figures & data
Figure 1 Formation and isolation of human LGCs. (A) Representative pathological image of a cutaneous tuberculosis case showing LGC (arrow) in granuloma. Hematoxylin and eosin stain. Scale bar, 100 μm. (B) In vitro granuloma model (arrowhead) induced by rhGM-CSF plus rhIFN-γ for 7 days. LGC formation was also observed (arrow). Scale bar, 50 μm. (C) Schematic diagram of human LGC induction and isolation in vitro for RNA sequencing.
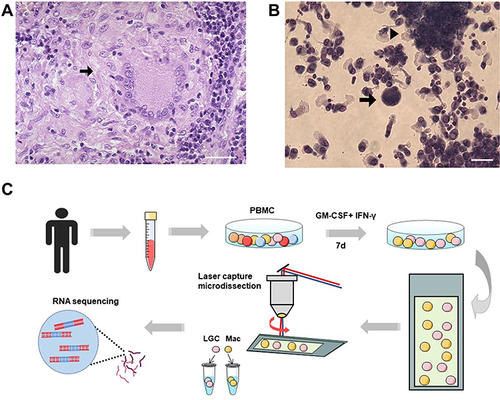
Figure 2 RNA sequencing analyses of in vitro human LGCs and macrophages. (A) Average ratio of the cells before and after the LCM. RNA sequencing was performed on the cell sample in the LGC group and macrophage group after the LCM. (B) Violin plot depicting the gene expression distributions of LGCs and macrophages. (C) Volcano plot showing log2 fold change plotted against log10 adjusted P value of DEGs. (D) Heatmap of unsupervised hierarchical clustering of DEGs.
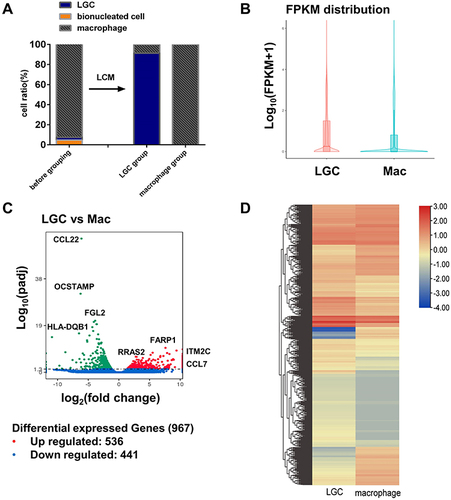
Figure 3 GO and KEGG enrichment analysis of the up-regulated genes in LGC group. (A) GO functional enrichment analysis. (B) KEGG pathway enrichment analysis. The red frames show the representative terms.
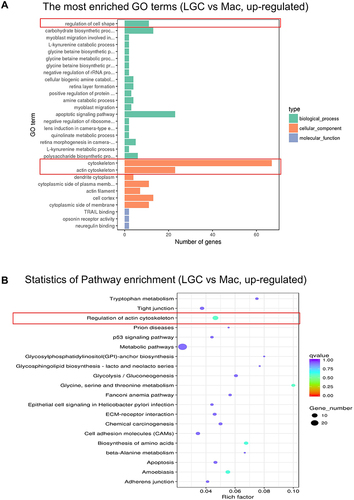
Figure 4 GO and KEGG enrichment analysis of the down-regulated genes in LGC group. (A) GO functional enrichment analysis of DEGs. The red frames show the representative terms. (B) The GO functional enrichment analysis of the immune response related DEGs. (C) KEGG pathway enrichment analysis. The rectangle with red dotted border shows granulomatous diseases.
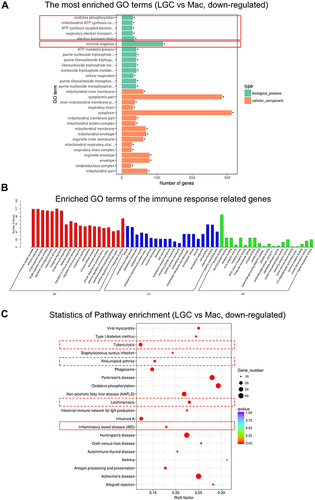
Figure 5 Protein–protein interaction networks analysis. The network construct from the top 150 DEGs. The nodes represent proteins. Edges stand for protein–protein associations. The disconnected nodes in the network were hided.
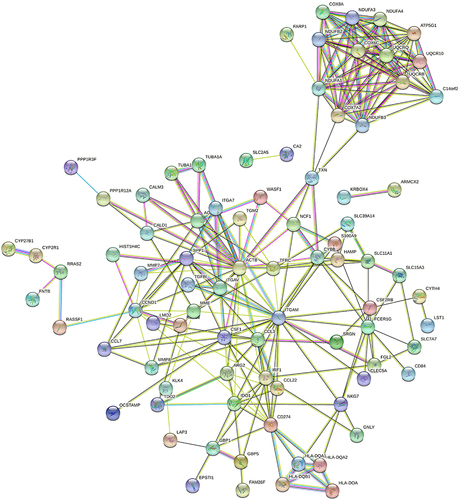
Figure 6 Validation of selected DEGs by RT-qPCR. The mRNA levels of CCL7, RRASF1, RRAS2, OSBPL3, ITM2C, and PPP1R12A in the LGC formation group (GM-CSF + IFN-γ for 7 days) vs the GM-CSF-induced macrophage group (GM-CSF for 7 days). n = 3 in each group. ***P < 0.001, **P < 0.01, *P < 0.05.
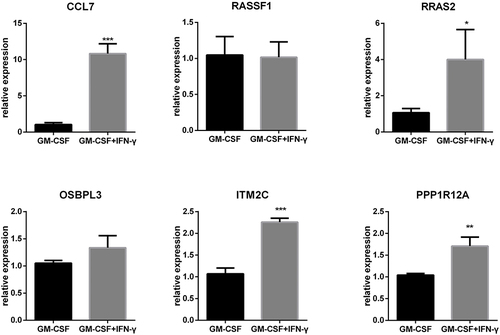
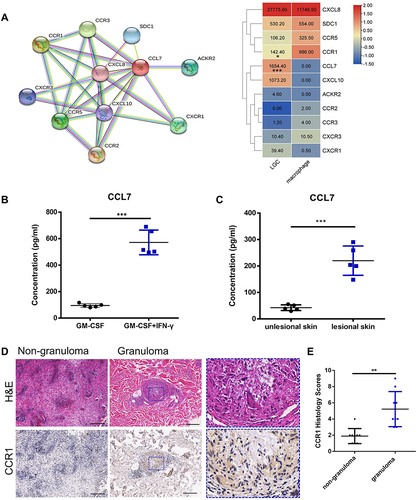
Figure 7 The expression levels of CCL7 and CCR1 in vitro and in vivo. (A) Network of CCL7 acquired from STRING database and the heatmap showing the average readout value of CCL7 and its related genes in LGCs. (B) Human CCL7 ELISA for LGC formation group (GM-CSF + IFN-γ for 7 day) (n=5) and GM-CSF-induced macrophage group (GM-CSF for 7 day) (n = 5). (C) CCL7 ELISA in the homogenate supernatant of lesional and non-lesioned skin tissue of leprosy patients (n = 3). (D and E) Immunohistochemical analysis of CCR1 expression in granuloma cells and non-granulomatous inflammatory cells in mycobacterial infectious diseases (n = 9). The rectangle with blue dotted border shows the magnification view. Scale bar, 200 μm. ***P < 0.001, **P < 0.01, *P < 0.05.