Figures & data
Figure 1 Overview of LPS/TLR-4 signaling pathway.
Abbreviations: LBP, LPS-binding protein; LPS, lipopolysaccharide; MCP, monocyte chemotactic protein; MIP, macrophage inflammatory protein; MyD88, myeloid differentiation marker 88; TLR, toll-like receptor; TNF-α, tumor necrosis factor-α; TRIF, TIR domain-containing adaptor inducing IFN-β.
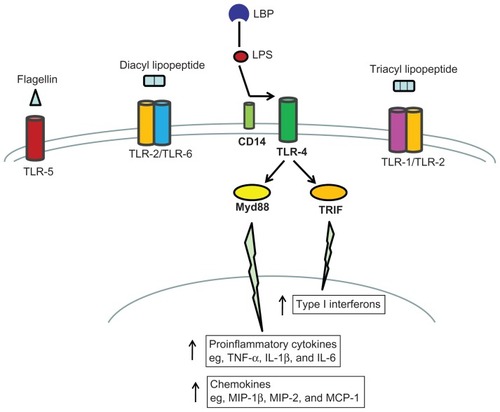
Figure 2 Relative mRNA expression of TLRs in the lung of P1, P21, and P70 animals. P1, P21, and P70 animals were treated with saline (S) or 0.25 mg/kg lipopolysaccharide (L) for 2 hours. Relative mRNA levels of TLR-2 (A), TLR-4 (B), TLR-5 (C), and TLR-6 (D) in the lung of these animals were measured by real-time reverse transcription PCR.
Abbreviations: mRNA, messenger RNA; P1, postnatal day 1; PCR, polymerase chain reaction; TLR, toll-like receptor.
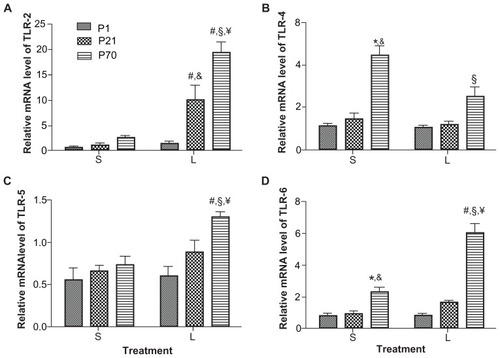
Table 1 Fold changes in the relative mRNA levels of inflammatory genes in the lung of animals at P1, P21, and P70 following treatment with saline (S) or lipopolysaccharide (L)
Figure 3 Relative mRNA expression of CD14, MyD88, and LBP in the lung of P1, P21, and P70 animals. P1, P21, and P70 animals were treated with saline (S) or 0.25 mg/kg lipopolysaccharide (L) for 2 hours. Relative mRNA levels of CD14 (A and B) and MyD88 (A and C) in the lung of these animals were measured by semi-quantitative reverse transcription PCR and the relative mRNA level of LBP (D) was measured by real-time reverse transcription PCR.
Abbreviations: LBP, lipopolysaccharide binding protein; MyD88, myeloid differentiation marker 88; P1, postnatal day 1; mRNA, messenger RNA; PCR, polymerase chain reaction.
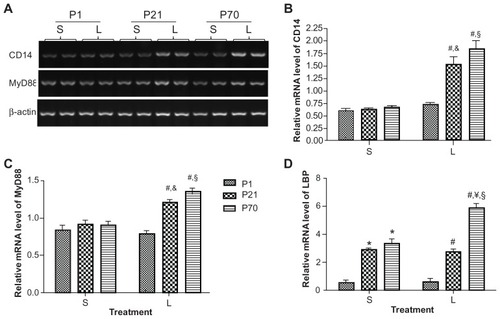
Figure 4 Relative mRNA expression of proinflammatory cytokines in the lung of P1, P21, and P70 animals. P1, P21, and P70 animals were treated with saline (s) or 0.25 mg/kg lipopolysaccharide (L) for 2 hours. Relative mRNA levels of TNF-α (A and B), IL-1β (A and C), and IL-6 (A and D) in the lung of these animals were measured by semiquantitative reverse transcription PCR.
Abbreviations: IL, interleukin; P1, postnatal day 1; PCR, polymerase chain reaction; TNF, tumor necrosis factor.
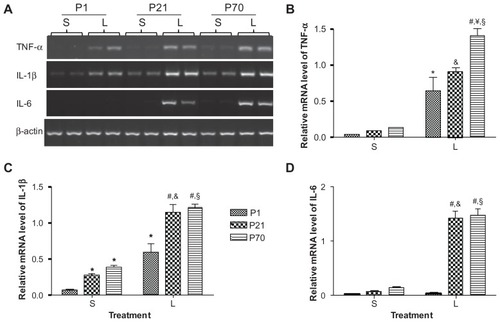
Figure 5 Relative mRNA expression of anti-inflammatory cytokines in the lung of P1, P21, and P70 animals. P1, P21, and P70 animals were treated with saline (S) or 0.25 mg/kg lipopolysaccharide (L) for 2 hours. Relative mRNA levels of IL-10 (A and B) and IL-1ra (A and C) in the lung of these animals were measured by semiquantitative reverse transcription PCR.
Abbreviations: IL-10, interleukin-10; IL-1ra, interleukin-1 receptor antagonist; mRNA, messenger RNA; P1, postnatal day 1.
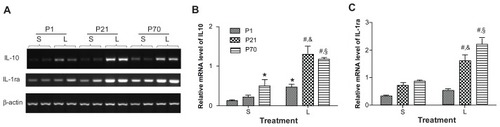
Table 2 Ratios of the relative mRNA levels of proinflammatory to anti-inflammatory cytokines in the lung of P1, P21, and P70 animals following treatment with saline (S) or lipopolysaccharide (L)
Figure 6 Relative mRNA expression of chemokines in the lung of P1, P21, and P70 animals. P1, P21, and P70 animals were treated with saline (S) or 0.25 mg/kg lipopolysaccharide (L) for 2 hours. Relative mRNA levels of MIP-1β (A and B), MIP-2 (A and C), and MCP-1 (A and D) in the lung of these animals were measured by semiquantitative reverse transcription PCR.
Abbreviations: MCP-1, monocyte chemotactic protein-1; MIP, macrophage inflammatory protein; P1, postnatal day 1.
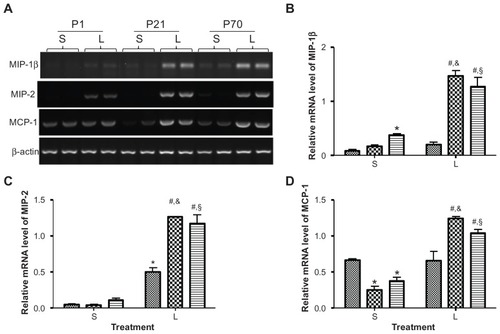
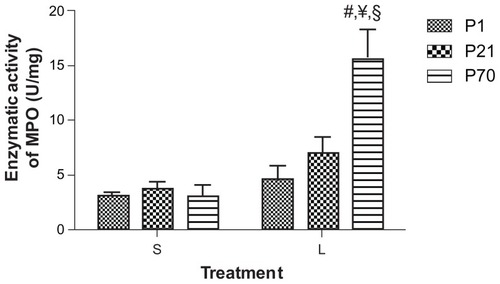
Figure 7 Enzymatic activity of myeloperoxidase (MPO) in the lung of P1, P21, and P70 animals. P1, P21, and P70 animals were treated with saline (S) or 0.25 mg/kg lipopolysaccharide (L) for 2 hours. MPO activity in the lung of these animals was then measured by enzymatic assay.
Abbreviation: P1, postnatal day 1.