Figures & data
Figure 1 (A and B) Changes in recipient fecal bacterial composition following FMT. Relative abundances of taxonomic groups were described in 4 groups (recipients a week prior to FMT and 2 and 8 weeks after FMT and donors). Bacteroidetes increased and Proteobacteria decreased at the phylum level after FMT, and the bacterial composition at the order level showed increasing Bacteroidales and diminishing Enterobacteriales. (C–F) Changes in alpha diversity according to various indices. Significant differences among groups were not found for observed features or Chao1 but were observed for Simpson diversity (*Wilcoxon signed-rank test p < 0.05 for Pre and Donor) and phylogenetic diversity (*Wilcoxon signed-rank test p < 0.05 for 2 wk and Donor).
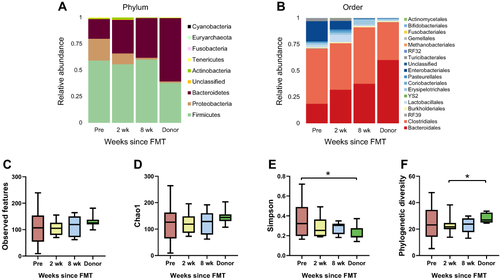
Figure 2 (A and B) Tracking the distance in beta diversity between FMT recipients and donors. According to the weighted UniFrac matrix, 2 weeks after FMT, the distance between the bacterial community structures of patients and donors decreased, but at 8 weeks the distance increased. Conversely, the distance between patients and donors first increased and then decreased according to the Unweighted UniFrac matrix. The beta diversities in the weighted and unweighted UniFrac matrices did not reveal a consistent pattern (Wilcoxon signed-rank test p > 0.05). (C and D) Proportions of origin of the fecal bacterial communities of recipients and bacterial engraftment following FMT as determined using Sourcetracker2. The proportions were calculated for the ASV and genus levels, respectively.
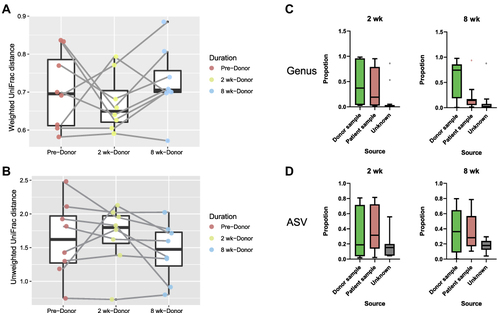
Figure 3 (A) Relative abundances of the top 30 genera in rCDI patients and donors. Prevotella exhibited significant increases in both the 2 wk and 8 wk groups compared to the Pre group (Wilcoxon signed-rank test p < 0.05). (B–D) Spearman correlations between Prevotella and the ratio of Bacilli over Clostridia (B/C ratio), CRP, and ESR (r = −0.426, p = 0.038 for B/C ratio; r = 0.034, p = 0.873 for CRP; r = −0.202, p = 0.344 for ESR, Spearman). (E) Shifts in the MD index following fecal microbiota transplant, revealing that the initially significantly higher value in rCDI patients decreased to be comparable to that to donors in the 8 weeks following FMT (*Wilcoxon signed-rank test p < 0.05).
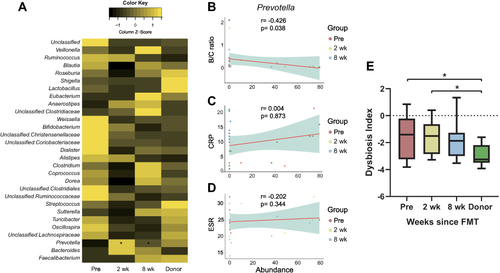
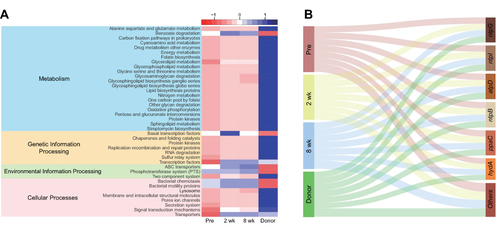
Figure 4 (A) Forty predicted metabolic pathways were selected from the results of PICRUSt2 using LEfSe (LDA > 2.5, Wilcoxon signed-rank test p > 0.05) and are described using a heatmap. (B) Sankey diagram showing genetic quantitative distribution for each group, suggesting that donors exhibit the largest amount of genes involved in oxidative phosphorylation, but it leans toward genes other than ntpG, ntpI, atpD, ntpB, ppaC and hydA, which were more abundant in the Pre group (no significant differences in the amount of each gene among groups, Wilcoxon signed-rank test p > 0.05).