Figures & data
Table 1 Comparison of Baseline Clinicopathological Characteristics Between the Training and Validation Cohorts
Figure 1 Process diagram for INPS construction and risk stratification (the asterisk *means the multiplication).
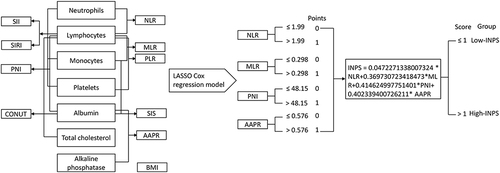
Figure 2 Construction of the INPS by using LASSO Cox regression model. (A) A correlation matrix with correlation coefficients from −1 (negative correlation; blue) to 1 (positive correlation; red). (B) LASSO coefficient profiles of the 10 inflammatory- nutritional biomarkers. The horizontal axis (bottom) represented the log(λ) value of the independent variable, the horizontal axis (top) represented the number of variables with non-zero coefficient, the vertical axis represented the coefficient of the independent variable, and each curve represented the variation trajectory of the coefficient of each independent variable. (C) Ten-fold cross‐validation for tuning parameter selection in the LASSO model. The dotted vertical lines were drawn at the best value of log(λ) by using the minimum criteria and 1-SE criteria. Solid vertical lines represented partial likelihood deviance ± SE. The intersection point of the left dotted line and the abscissa axis (bottom) showed the optimal value of log(λ), the corresponding value in the abscissa axis (top) showed the number of variables with non-zero coefficient identified at the optimal log(λ).
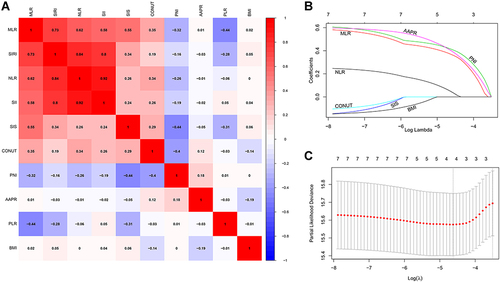
Figure 3 Survival curves obtained with Kaplan-Meier analysis between different INPS groups. The HRs reported were unadjusted. (A) Survival curves in the training cohort. (B) Survival curves in the validation cohort.
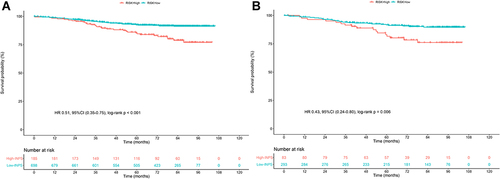
Figure 4 Results of the final stepwise multivariate Cox regression analysis in the training cohort in a forest plot. The HRs reported were unadjusted, *P < 0.05.
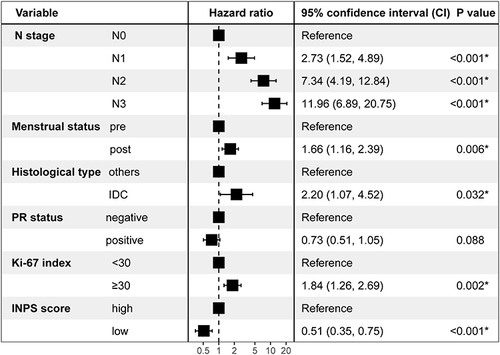
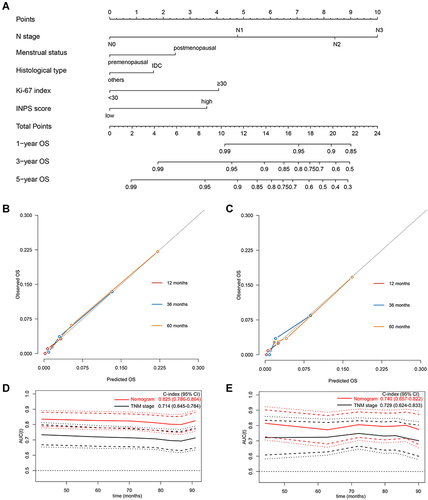
Figure 5 Development and validation of the prognostic model. (A) A nomogram of the current prognostic model for individualized survival predictions. (B) Calibration plot of the nomogram model at 1-, 3-, and 5-year in the training cohort. (C) Calibration plot of the nomogram model at 1-, 3-, and 5-year in the validation cohort. (D) Time-independent ROC curves compared the predictive accuracy (C-index with its 95% CI) of the current model (the red line) and the traditional TNM stage (the black line) in the training cohort. (E) Time-independent ROC curves compared the predictive accuracy (C-index with its 95% CI) of the current model (the red line) and the traditional TNM stage (the black line) in the validation cohort.