Figures & data
Figure 1 In vivo data and circulating IL6 levels in experimental and control groups of mice after injection of PBS or 2.5 mg/kg LPS and 15 mg/kg CyPPA or solvent. Core body temperature (Tb) (A), thermal index over 4 and 24 hours (B), IL6 plasma levels (C), locomotor activity over time (D), cumulative motor activity (E), body weight, food and water intake (F). Injection at time point 0. (A-–C) six animals per group; (D-,E) n=4 for solvent + LPS, 5 for the other groups; (F) five per group. %=Main effect of treatment 1 (solvent vs CyPPA), *=main effect of treatment 2 (PBS vs LPS), #=solvent + PBS vs solvent + LPS, &=CyPPA + PBS vs solvent + PBS, $=CyPPA + PBS vs CyPPA + LPS; %%%P<0.001; *P<0.05; **P<0.01; ***P<0.001; ##P<0.01; &P<0.05; $$$P<0.001.
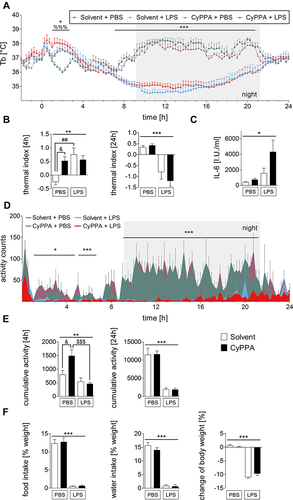
Figure 2 Comparison of hypothalamic mRNA expression of inflammatory marker proteins 24 hours after injection of PBS or 2.5 mg/kg LPS and 15 mg/kg CyPPA or solvent. The pro-inflammatory cytokine interleukin (IL)6 (A), the negative regulator and marker for signal transducer and activator of transcription 3 activation, suppressor of cytokine signaling (SOCS)3 (B), the rate limiting enzymes of prostaglandin synthesis, namely, cyclooxygenase (COX)2 (C), and microsomal prostaglandin synthase (mPGES,D) are displayed. Moreover, CD68 a marker of microglia activity (E), the transcription factor NF-IL6 (F) and the marker of nuclear factor κB activation, inhibitors (I)κBα (G) are shown. No difference was observed in CyPPA- (15 mg/kg) treated animals compared to solvent treated ones. n=5 for all groups. *Main effect of treatment 2 (PBS vs LPS); **P<0.01; ***P<0.001.
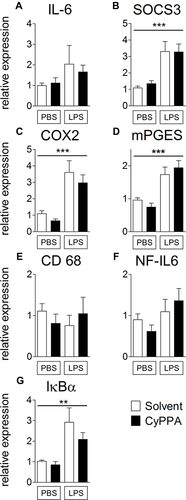
Figure 3 Assessment of microglial CD11b staining (red) in the fimbria of hippocampus 24 hours after treatment with PBS, or 2.5 mg/kg LPS and solvent, or CyPPA (15 mg/kg). CD11b immunoreactivity (red) in the fimbria of hippocampus (overview); nuclear DAPI staining (blue). Representative microphotographs of all four treatment groups (A–D solvent vs CyPPA and PBS vs LPS) and representative high-magnification insets, which were also derived from the fimbria of hippocampus, are depicted in A–D. The area covered by CD11b-positive tissue (red) was obtained using color cube-based image analyses (Image Pro Plus) and expressed as percentage of the area of interest (E). Five animals per group, four to eight microphotographs per animal analyzed; scale bar in D represents 100 µm and applies to all overview microphotographs; 10 µm in d for all inserts.
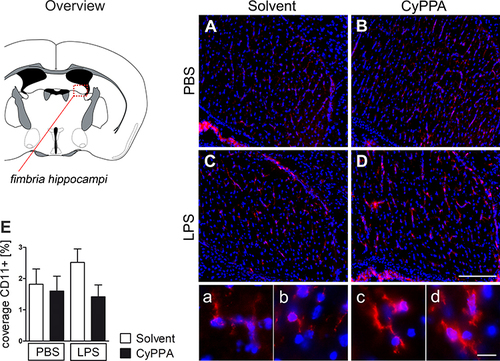
Figure 4 Early CyPPA (15 mg/kg) versus solvent action in vivo 2 hours after treatment. Core body temperature (Tb [°C]) (A), the thermal index (B), IL6 plasma levels (C), as well as locomotor activity over time (D) and cumulated (E) are displayed. Six animals per group.
![Figure 4 Early CyPPA (15 mg/kg) versus solvent action in vivo 2 hours after treatment. Core body temperature (Tb [°C]) (A), the thermal index (B), IL6 plasma levels (C), as well as locomotor activity over time (D) and cumulated (E) are displayed. Six animals per group.](/cms/asset/f7f852e9-ad3d-4c6b-b9fc-cffb4396ed78/djir_a_12199452_f0004_c.jpg)
Figure 5 Assessment of early CyPPA action on hypothalamic and cortical mRNA expression of inflammatory marker proteins 2 hours after CyPPA (15 mg/kg) treatment compared to control animals (solvent) (A–N). The proinflammatory cytokine IL6 (A and H), the negative regulator and marker for STAT3 activation, SOCS3 (B and I), the rate-limiting enzymes of prostaglandin synthesis, namely COX2 (C and J), and microsomal prostaglandin synthase (mPGES; D, K) are displayed. CD68 a marker of microglial activity (E and L), the transcription factor NF-IL6 (F and M) and marker of NFκB-activation inhibitors (I) κBα (G and N) are shown. Six animals per group; one outlier discarded for SOCS3 in the CyPPA group (n=5). *P<0.05 and **P<0.01 for solvent vs CyPPA.
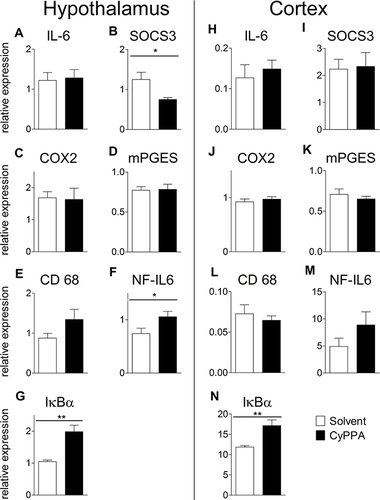
Figure 6 Western blot analyses of early CyPPA action on cortical NFκB signaling 2 hours after CyPPA (15 mg/kg) or solvent treatment. Exemplary protein bands are shown out of 6 samples P65 (A), pp65 (phospho p65) (B), IκBα (C), and pp65/p65 quotients without (D and E) and with normalization to tubulin (F) are displayed. Quantification was based on tubulin expression levels. Six per group. *P<0.05 for solvent vs CyPPA.
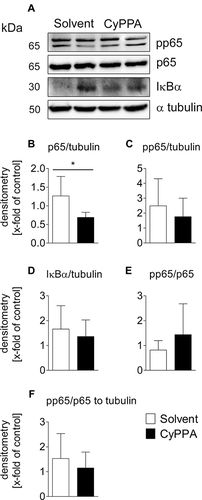
Figure 7 Analyses of CyPPA-mediated induction of hypothalamic nuclear STAT3 translocation 2 hours after treatment with either solvent or CyPPA (15 mg/kg). Immunohistochemical detection of STAT3 (red) in the vascular organ of the lamina terminalis (OVLT; schematic neuroanatomical overview in A) depicted as nuclear signals (pink) in an LPS-treated animal as positive control with typical distribution (B). Representative microphotographs of solvent (C) and CyPPA treatment (D) with high-magnification insets of areas highlighted with dotted squares. For better orientation, von Willebrand factor (green) was used to label endothelial cells. Semiquantitative evaluation of the immunohistochemistry between solvent and CyPPA groups (at least two brain sections per animal, six animals per group) is shown in E. Bars in B apply to all overview microphotography and represent 100 µm, 10 µm for inserts.
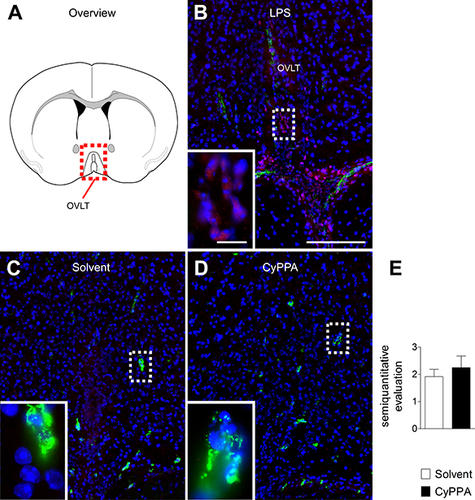
Figure 8 HPLC analysis of nucleotides in the liver as markers for changes in energy turnover induced by CyPPA 2 hours after CyPPA (15 mg/kg) or solvent application (A–I). Amount of intracellular adenosine (A), nmol/mg wet weight (WW), AMP B), ADP (C), ATP (D), GDP (E), GTP (F) concentrations and ATP:ADP (G) and GTP:GDP ratios. Cellular protein levels are displayed in I. n=6 animals per group. *P<0.05; ***P<0.001 for solvent vs CyPPA.
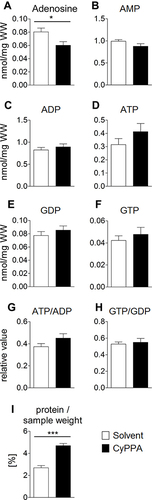
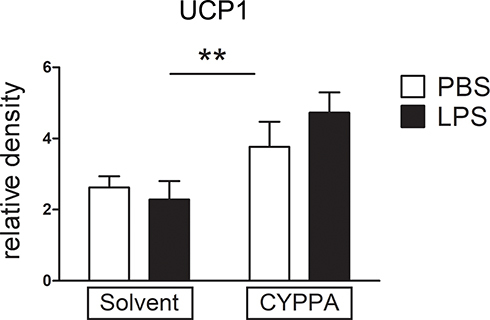
Figure 9 Comparison of brown adipose tissue (BAT)–explant cultures in experimental and control groups. Mouse BAT was stimulated with LPS or PBS and cotreated with solvent or CyPPA (25 µM) for 2 hours and mRNA expression of UCP1 was assessed. Results out of four independent experiments, with every well consisting of one mouse (biological replicate). One well was discarded due to bacterial contamination, one after outlier testing. PBS eight and LPS seven wells. **P<0.005 for solvent vs CyPPA.