Figures & data
Figure 1 Study workflow.
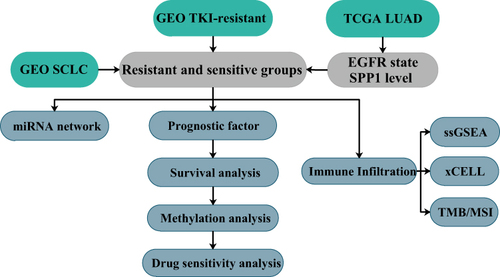
Figure 2 (A) Venn diagram, common DEGs of GSE122005, GSE31625, GSE62504. (B) a. GO enrichment; b. KEGG pathway annotation. (C) PPI network of DEGs was constructed in Cytoscape; the greater the degree of correlation between genes, the larger the circle and darker the colors.
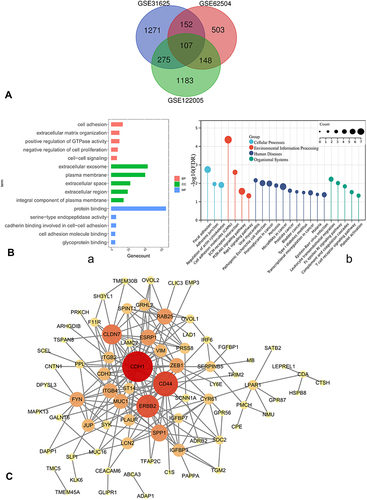
Figure 3 (A) The expression level of hub genes in lung adenocarcinoma and normal tissues in GEPIA (*P < 0.01). (B) Survival analysis. Expression level of SPP1 and ITGB4 was related to the overall survival of LUAD and LUSC patients (P < 0.05), expression level of SPP1+ZEB1 was related to overall survival of LUAD and LUSC patients (P < 0.05).
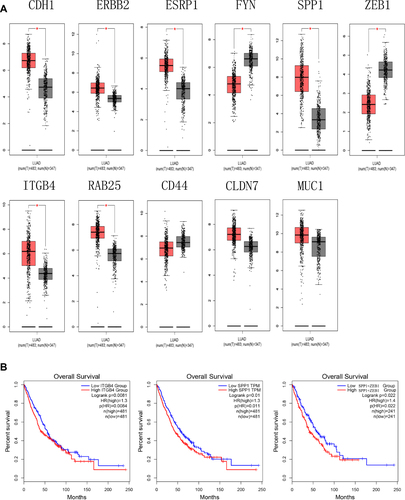
Figure 4 (A) Validation of the SPP1 expression in multiple tumors. (B) Validation of the SPP1 expression by the Human Protein Atlas database. a. SPP1 of immunohistochemistry in normal lung tissue; b. SPP1 of immunohistochemistry of LUAD tissue. (C) SPP1 expression in EGFR-mutant/wild LUAD and normal groups from TCGA. P value significant codes: *P < 0.05, **P < 0.01, ***P < 0.001, ****P < 0.0001.
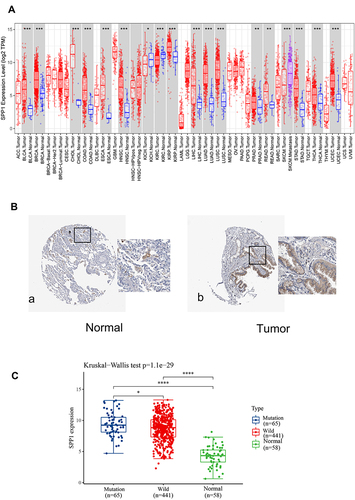
Figure 5 (A) Upper panel: The scatter plot of SPP1 expression from low to high, different colors represent different expression groups; Middle panel: The survival time and survival status of patients; Lower panel: Heatmap of SPP1 in EGFR-mutant LUAD. The abscissas of the upper, middle, and lower panels all represent same samples. (B) Kaplan–Meier survival analysis of SPP1. (C) Time-dependent ROC analysis of SPP1.
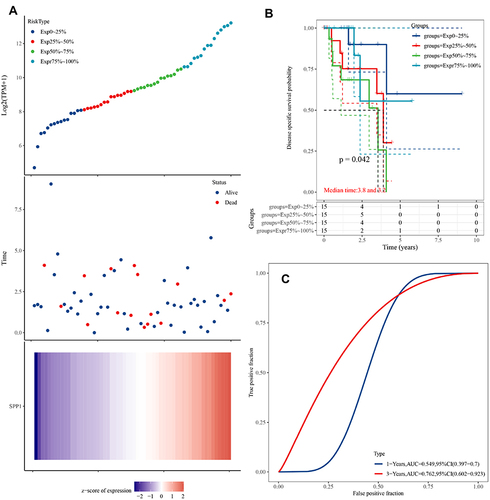
Figure 6 (A) The relationship of SPP1 expression level and tumor immune infiltration level. (B) The immune scores distribution of EGFR-mutant and wild-type in LUAD. Blue color represents EGFR-mutant group, yellow represents EGFR-wild group. (C) The immune scores distribution of SPP1 high and low expression in LUAD. Blue color represents SPP1 high group, yellow represents SPP1 low group. P value significant codes: *P < 0.05, **P < 0.01, ****P < 0.0001.
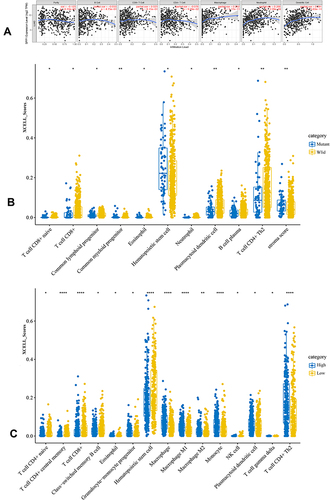
Figure 7 Immune landscape of GSE31625. (A) Heatmap of two subtypes from the GSE31625 based on ssGSEA scores calculated from 28 immune cells. (B) Correlation between anti-tumor immunity and pro-tumor immune suppressive functions; R: coefficient of Pearson’s correlation; the shaded area represents 95% confidence interval. (C) Correlation of 28 immune cells. (D) The relative immune infiltration scores of 28 immune cells between erlotinib-sensitive and resistant groups. P value significant codes: *P < 0.05, **P < 0.01, ***P < 0.001, ****P < 0.0001.
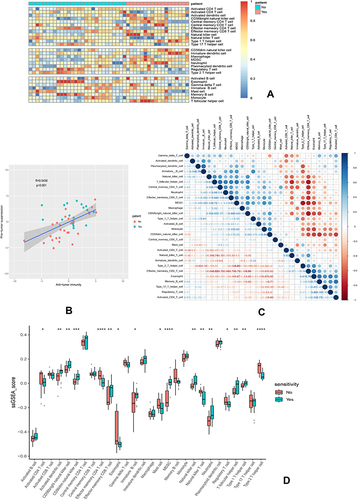
Figure 8 (A) A forest plot showed the prognostic value of SPP1 expression according to different immune cell subgroups in LUAD patients. (B) Correlation between PD-L1 and SPP1. (C) Correlation analysis of TMB and SPP1. (D) Correlation analysis of MSI and SPP1. The horizontal axis in the figure represents the correlation coefficient; the ordinate is different tumors. The size of dot represents the correlation coefficient, and colors represent the significance of P value. (E) A Venn diagram of SCLC and three TKI-resistant profiles. (F) RNA-miRNA network of five hub genes.
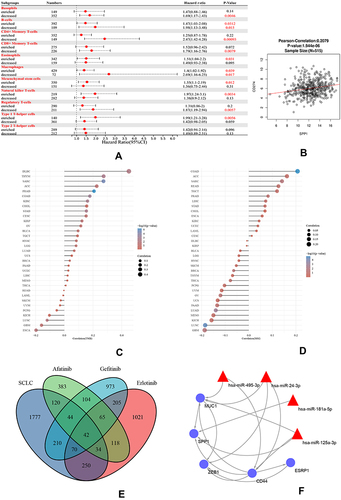
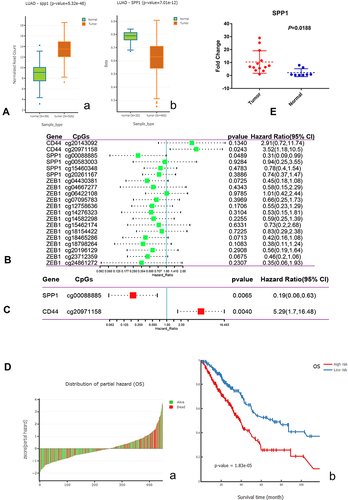
Figure 9 (A) a. Boxplot of expression of SPP1 in LUAD; b. Boxplot of DNA methylation of SPP1 in LUAD. (B) Univariate Cox analysis of hub gene CpGs. (C) Multivariate Cox analysis of hub gene CpGs. (D) a. Z-score distribution of the prognostic classifier and patients’ survival status; b. Kaplan–Meier survival analysis for LUAD patients based on multivariate proportional hazards regression model. (E) The high expression of SPP1 in EGFR-mutant lung adenocarcinoma compared with paracancerous tissues by qRT-PCR.