Figures & data
Figure 1 Polyacrylamide gel electrophoresis of influenza A and H1N1 proteins. Lane 1, influenza A virus vaccine; lane 2, H1N1 virus vaccine; lane 3, broad weight molecular weight marker.
Notes: The gel was prepared as described in the Materials and methods section. The amount of protein loaded in each track was 0.9 μg/mL influenza A virus vaccine and 0.3 μg/mL H1N1 virus vaccine. Staining was with Coomassie brilliant blue G.
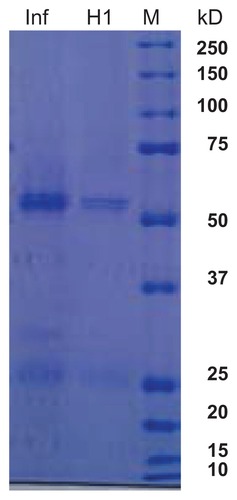
Table 1 Subject characteristics
Figure 2 Immunoblot analysis of IgG and IgE anti-H1N1 virus antibodies.
Notes: Serum from subjects with a past history of influenza virus vaccination and H1N1 infection, influenza virus vaccine and no H1N1 infection, or unvaccinated and uninfected controls was incubated with nitrocellulose strips containing H1N1 virus vaccine antigen (see Materials and methods section). IgG (left panel) representative blot of subject vaccinated with influenza virus vaccine, and infected with H1N1 virus; development time, 10 seconds. IgE (right panel), representative blot of subject vaccinated with influenza virus vaccine and infected with H1N1 virus; development time, 7 seconds. Data represent one of two patients with similar results.
Abbreviation: Ig, immunoglobulin.
Abbreviation: Ig, immunoglobulin.
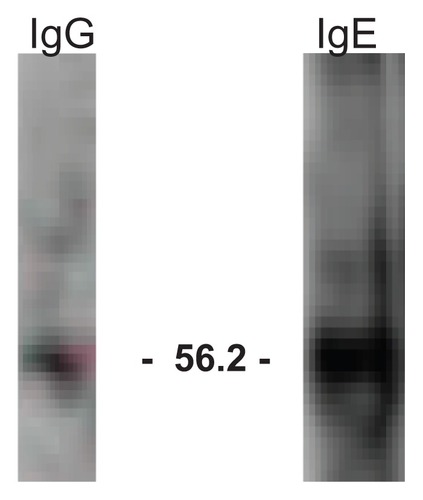
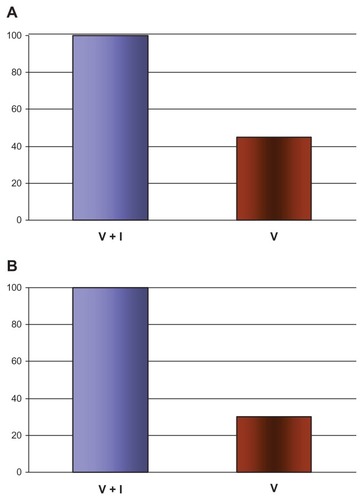
Figure 3 Comparison of IgG and IgE anti-H1N1 virus antibodies after vaccination with subsequent infection.
Notes: Serum from subjects vaccinated with influenza vaccine with a past history of H1N1 infection (V + I) compared with vaccine alone (V) were assessed for IgG (Figure 3B) and IgE (Figure 3B) anti-H1N1 antibody production. Data represent comparative scoring of intensity of Western blot (from ) of two patients, as determined by averaging mean assessments by four blinded referees (score range 1–10).
Abbreviation: Ig, immunoglobulin.
Abbreviation: Ig, immunoglobulin.