Figures & data
Table 1 The Characteristics of Antibodies
Table 2 RT-qPCR Primers
Figure 1 EtOH‑fed mice had higher levels of CD73 than pair‑fed mice. (A) The process of alcohol-induced liver injury and inflammation. (B) Body weight loss, n=6. (C) Liver index increases, n=6. (D) Serum ALT and AST levels, n=5–6. (E) Hepatic TG and T-CHO levels, n=5–6. (F) Representative H&E staining of liver sections (100 μm, 20 μm). (G) Representative Oil Red O staining of liver sections (100 μm, 20 μm). (H) Representative BODIPY staining of liver sections (50 μm, 20 μm). (I) The expression of IL-6 was detected by IHC (50 μm, 20 μm). (J) The expression of IL-1β was detected by IHC (50 μm, 20 μm). (K) The mRNA levels of IL-6 and IL-1β in the liver. (L) The release of the inflammatory cytokines IL-6 and IL-1β from serum was measured by ELISA. **P < 0.01, ***P < 0.001 compared with the pair-fed group.
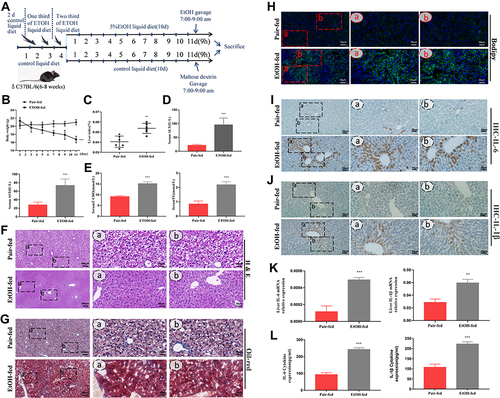
Figure 2 The expression of CD73 was increased in EtOH-primed RAW264.7 cells (A) The protein level of CD73 in the liver. (B) The mRNA level of CD73 in the liver. (C) The expression of CD73 was detected by IHC (50 μm, 20 μm). (D) Double immunofluorescence staining of CD73 (red) and F4/80 (green); representative views from the pair-fed group and EtOH-fed group were presented (20 μm). *P < 0.05, **P < 0.01 compared with the pair-fed group.
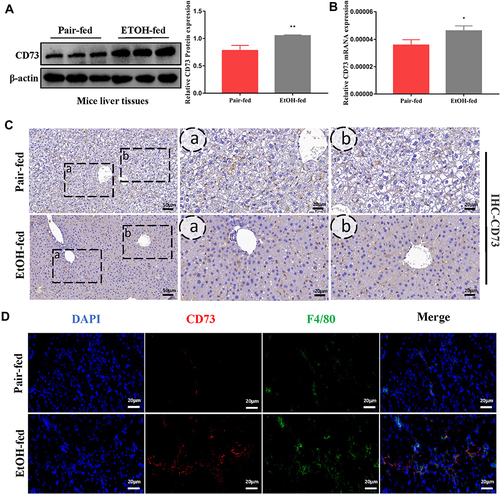
Figure 3 The expression of CD73 was increased in EtOH-primed RAW264.7 cells. (A) Effect of different concentrations of EtOH on RAW264.7 cell viability by CCK-8 assay. (B and C) The protein level of CD73 in RAW264.7 cells. *P < 0.05, **P < 0.01 compared with 0 mM. (D and E) The protein level of CD73 in RAW264.7 cells. *P < 0.05 compared with 0 h. (F and G) The protein level of CD73 in RAW264.7 cells. (H) The mRNA level of CD73 in RAW264.7 cells. (I) The release of the inflammatory cytokines IL-6 and IL-1β from RAW264.7 cells into serum was measured by ELISA. (J) The mRNA levels of IL-6 and IL-1β in the liver. **P < 0.01, ***P < 0.001 compared with the control group.
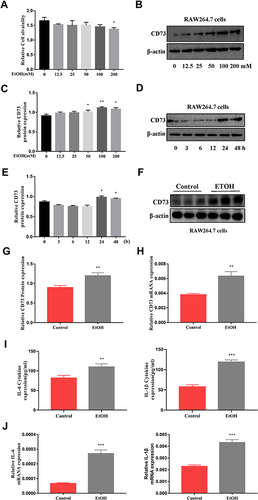
Figure 4 CD73 inhibited the secretion of IL-6 and IL-1β in RAW264.7 cells induced by EtOH. (A) The protein and mRNA levels of CD73 in RAW264.7 cells. **P < 0.01 compared with the control group. ##P < 0.01, ###P < 0.001 compared with the pEX3-NC+EtOH group. (B) The protein and mRNA levels of CD73 in RAW264.7 cells. **P < 0.01 compared with control group. ##P < 0.01, ###P < 0.001 compared with the scrambled-siRNA+EtOH group. (C) The levels of proinflammatory cytokines (IL-6 and IL-1β) in culture supernatants were determined by ELISA, and the mRNA levels of IL-6 and IL-1β in RAW264.7 cells. *P < 0.05, ***P < 0.001 compared with the control group. #P < 0.05, ##P < 0.01, ###P < 0.001 compared with the pEX3-NC+EtOH group. (D) The levels of proinflammatory cytokines (IL-6 and IL-1β) in culture supernatants were determined by ELISA, and the mRNA levels of IL-6 and IL-1β in RAW264.7 cells. *P < 0.05, **P < 0.01, ***P < 0.001 compared with the control group. #P < 0.05, ##P < 0.01 compared with the scrambled-siRNA+EtOH group.
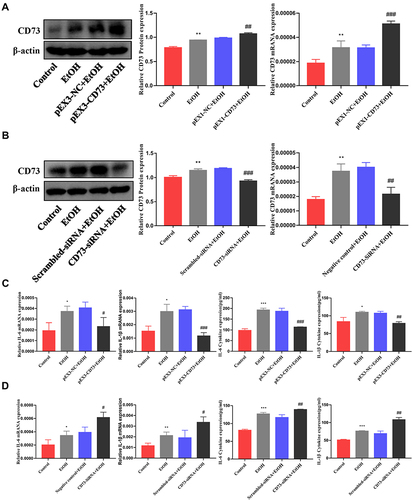
Figure 5 rAAV9‑CD73 protected against alcohol-induced liver injury and inflammation. (A) Small animal in-vivo imaging system. (B) Liver index, n=6. (C) Serum ALT and AST levels, n=5–6. (D) Hepatic TG and T-CHO levels, n=5–6. (E) Representative H&E staining of liver sections (50 μm). (F) Representative BODIPY staining of liver sections (50 μm). (G) The expression of CD73 was detected by IHC (50 μm). (H) The mRNA level of CD73 in the liver. (I) The mRNA levels of IL-6 and IL-1β in the liver. (J) The protein levels of CD73, IL-6 and IL-1β in the liver. (K) The protein levels of CD73, IL-6 and IL-1β in primary macrophages. *P < 0.05, **P < 0.01, ***P < 0.001 compared with the pair-fed group. #P < 0.05, ##P < 0.01, ###P < 0.001 compared with the rAAV9-empty-EtOH-fed group.
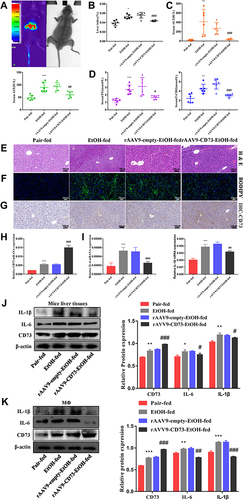
Figure 6 CD73 inhibits the apoptosis of RAW264.7 cells. (A) The effect of increased CD73 on the apoptosis of EtOH-activated RAW264.7 cells was determined by flow cytometry. **P < 0.01 compared with the pEX3-NC+EtOH group. (B) Expression of Bax, Bcl-2 and cleaved caspase-3 in RAW264.7 cells transfected with the pEX3-CD73. *P < 0.05, ***P < 0.001 compared with the control group. #P < 0.05, ###P < 0.001 compared with the pEX3-NC+EtOH group. (C) The effect of decreased CD73 on the apoptosis of EtOH-activated RAW264.7 cells was determined by flow cytometry. *P < 0.05 compared with the scrambled-siRNA+EtOH group. (D) Expression of Bax, Bcl-2 and cleaved caspase-3 in RAW264.7 cells transfected with CD73-siRNA. **P < 0.01 compared with the control group. #P < 0.05, ##P < 0.01 compared with the Scrambled-siRNA+EtOH group.
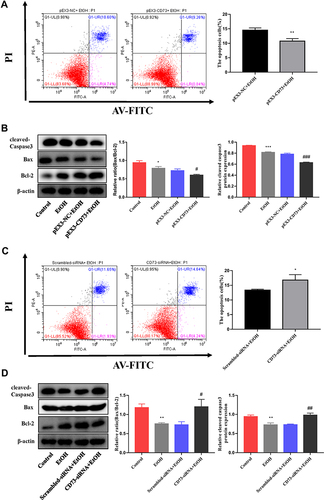
Figure 7 CD73 promotes the proliferation of RAW264.7 cells. (A) The effect of increased CD73 on the proliferation of EtOH-activated RAW264.7 cells was determined by flow cytometry. (B) Expression of c-Myc and CyclinD1 in RAW264.7 cells transfected with pEX3-CD73. **P < 0.01 compared with control group. ##P < 0.01 compared with the pEX3-NC+EtOH group. (C) The effect of decreased CD73 on the proliferation of EtOH-activated RAW264.7 cells was determined by flow cytometry. (D) Expression of c-Myc and CyclinD1 in RAW264.7 cells transfected with CD73-siRNA. *P < 0.05 compared with control group. #P < 0.05 compared with the scrambled-siRNA+EtOH group.
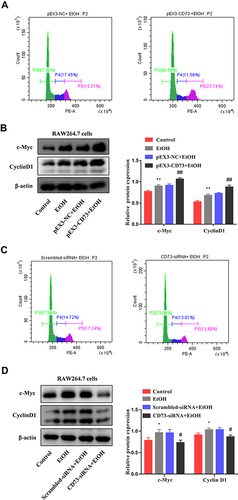
Figure 8 Overexpression of CD73 blocked the TLR4/MyD88/NF-κB signaling pathway. (A and E) The protein levels of TLR4, NF-κB, p-NF-κB and MyD88 in the liver. *P < 0.05, **P < 0.01 compared with the pair-fed group. (B, C, D, F, G and H) The protein levels of TLR4, NF-κB, p-NF-κB and MyD88 in RAW264.7 cells. *P < 0.05, **P < 0.01, ***P < 0.001 compared with the control group. #P < 0.05, ##P < 0.01, ###P < 0.001 compared with pEX3-NC+EtOH/ scrambled-siRNA+EtOH group.
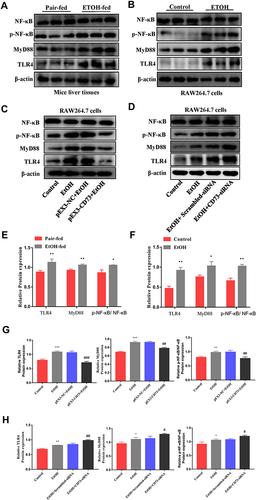
Figure 9 CD73 regulates the inflammatory response and apoptosis in EtOH treated RAW 264.7 cells through TLR4/MyD88/NF-κB. (A) Effect of different concentrations of TAK242 on RAW264.7 cell viability by CCK-8 assay. *P < 0.05, **P < 0.01 compared with 0 ng/mL. (B) The mRNA level of TLR4 in RAW264.7 cells. **P < 0.01 compared with 0 ng/mL. (C) The protein levels of IL-6 and IL-1β in RAW264.7 cells. (D) Expression of Bax, Bcl-2 and cleaved caspase-3 in RAW264.7 cells. (E) The apoptosis of RAW264.7 cells was determined by flow cytometry. (F) Expression of c-Myc and CyclinD1 in RAW264.7 cells. *P < 0.05, **P < 0.01, ***P < 0.001 compared with the pEX3-NC+EtOH group. #P < 0.05, ##P < 0.01, ###P < 0.001 compared with the pEX3-CD73+TAK242+EtOH group. (G) The proliferation of RAW264.7 cells was determined by flow cytometry.
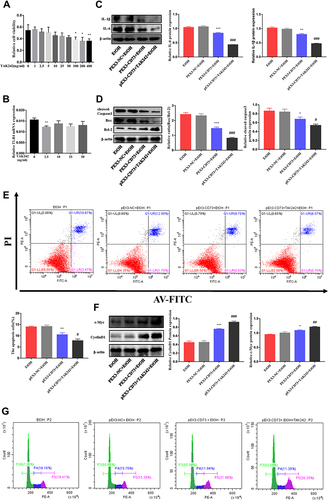
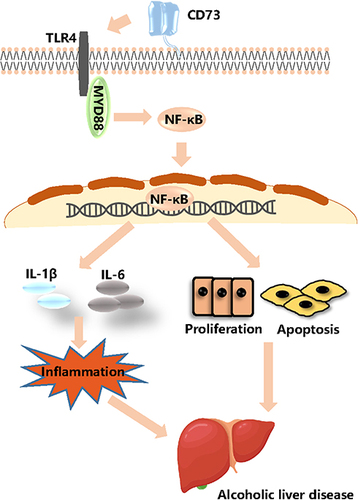
Figure 10 CD73 inhibited the release of inflammatory cytokines and RAW264.7 cell apoptosis through downregulation of the TLR4/MyD88/NF-κB signaling pathway.