Figures & data
Table 1 Characteristics of Glioma Patients in Training and Validation Cohorts
Figure 1 Expression, function and prognosis analyses of 31 PRGs in glioma. (A) The expression comparison of PRGs between glioma tissues (TCGA) and normal brain tissues (GTEx). (B) PPI network of PRGs. Elements not connected to others were hidden. (C, D) GO and KEGG pathway analysis of PRGs. (E) Univariate Cox regression analysis of PRGs in CGGA693 cohort. * p<0.05, *** p<0.001, and ns No significance.
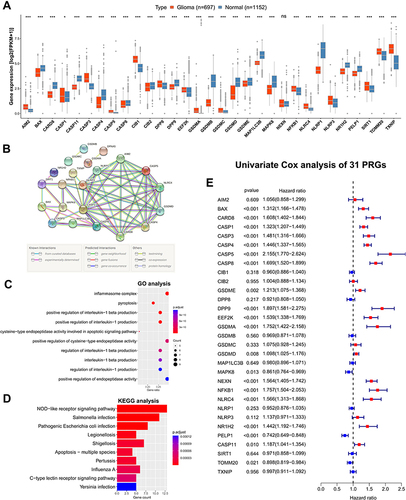
Figure 2 Construction and validation of the PRGPI in CGGA693 cohort. (A and B) The LASSO regression was performed with the minimum criteria. (C) Multivariate Cox regression was used to construct a PRGPI. (D) Kaplan–Meier curves of PRGPI subgroups for survival. (E) The distribution plots of PRGPI, survival status and expression of five selected PRGs. (F and G) Univariate and multivariate Cox regression analyses for identifying independent prognostic factors. (H–J) ROC curve analysis of PRGPI and clinicopathological characteristics in predicting 1-, 3- and 5-year OS.
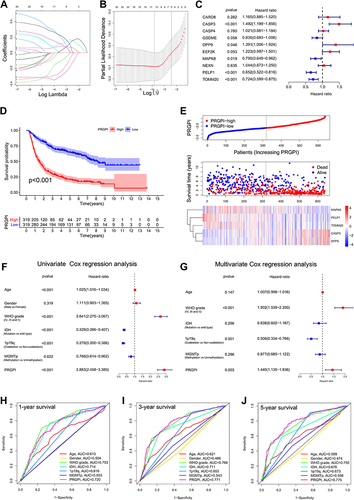
Figure 3 Validation of PRGPI in CGGA325 and TCGA cohorts. (A and B) Kaplan–Meier curves of PRGPI subgroups for survival in CGGA325 and TCGA cohorts. (C and D) The distribution plots of PRGPI, survival status and expression of five selected PRGs in CGGA325 and TCGA cohorts. (E and F) ROC curve analysis of PRGPI in predicting 1-, 3- and 5-year OS in CGGA325 and TCGA cohorts.
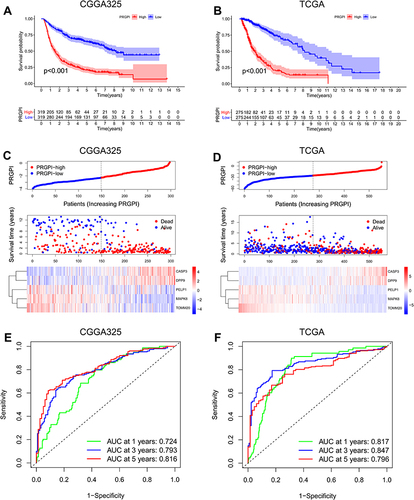
Figure 4 Construction and evaluation of a nomogram. (A) A nomogram was constructed based on PRGPI, 1p19q codeletion status and WHO grade in CGGA693 cohort. (B–D) Calibration curves showing the concordance between predicted and observed 1-, 3- and 5-year OS in CGGA693, CGGA325 and TCGA cohorts.
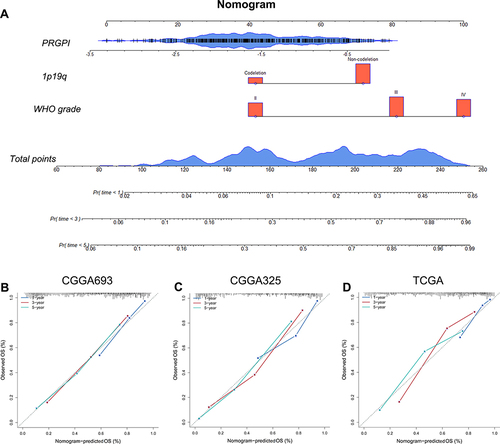
Figure 5 The immune microenvironment of different PRGPI subgroups in CGGA693 cohort. (A) Gene set enrichment analysis (GSEA) in PRGPI-high group (p < 0.05, FDR < 0.25). (B) The comparison of immune score, stromal score, ESTIMATE score and tumor purity between PRGPI-high and PRGPI-low groups. (C) The infiltration of 22 immune cells in PRGPI-high and PRGPI-low groups. (D) The proportions of 22 immune cells, and the clinicopathologic characteristics of different PRGPI subgroups. * p<0.05, ** p<0.01, *** p<0.001, and ns No significance.
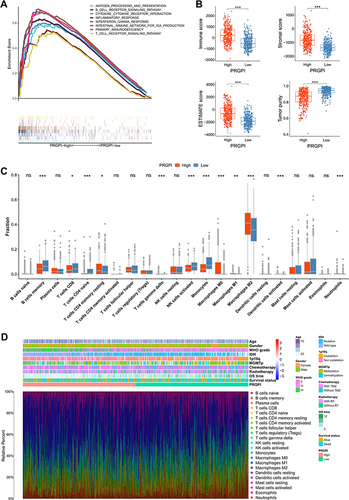
Figure 6 The mutation profile and tumor mutation burden (TMB) of different PRGPI subgroups in TCGA cohort. (A) Mutation profile in PRGPI-high group. (B) Mutation profile in PRGPI-low group. (C) The comparison of TMB between PRGPI-high group and PRGPI-low group. (D) The correlation of TMB with PRGPI. (E) Kaplan–Meier curves of different TMB and PRGPI subgroups for survival. *** p<0.001.
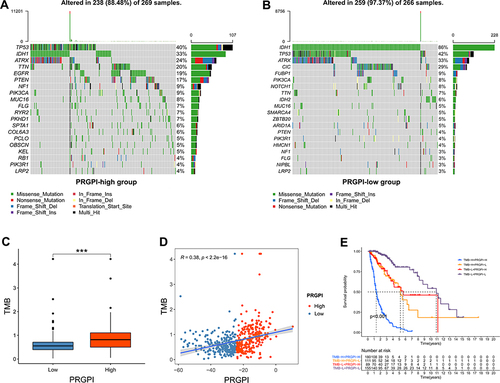
Figure 7 Evaluation of the PRGPI in indicating the response to ICI therapy. (A and B) The expression of immune checkpoints between PRGPI subgroups in CGGA693 and TCGA cohorts. (C and D) The correlations between immune checkpoints and five selected PRGs in CGGA693 and TCGA cohorts. (E and F) The distribution of ICI therapy responders in different PRGPI subgroups. (G and H) The comparison of PRGPI between responders and non-responders in CGGA693 and TCGA cohorts. (I and J) ROC curve analysis of PRGPI in predicting the response to ICI therapy in CGGA693 and TCGA cohorts. * p<0.05, ** p<0.01 and *** p<0.001.
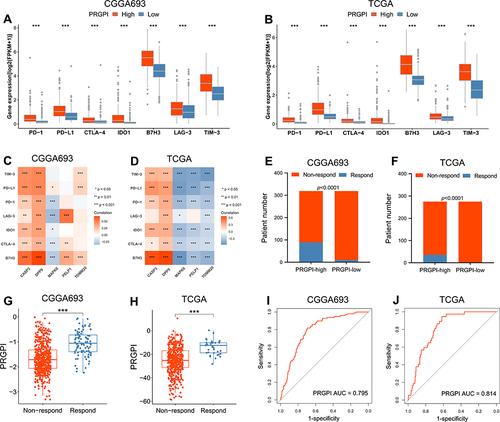
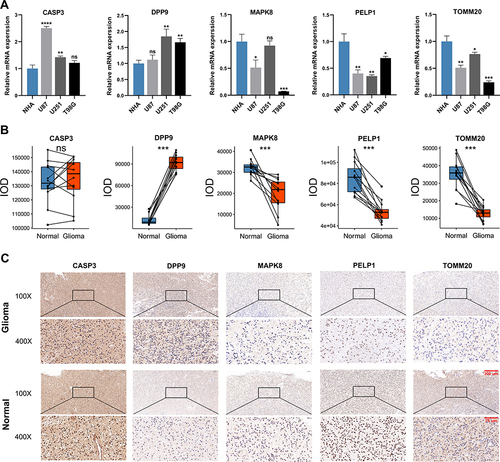
Figure 8 The expression patterns of five selected PRGs in cell lines and pathological specimens. (A) The expression of five selected PRGs in normal cell line, NHA, and three glioma cell lines, U87, U251, and T98G. (B) The protein level of five selected PRGs quantified by IOD in immunohistochemistry (IHC) staining. (C) Representative IHC staining of five selected PRGs in glioma and adjacent non-tumor tissues. * p<0.05, ** p<0.01, *** p<0.001, **** p<0.0001 and ns No significance.