Figures & data
Table 1 Relative Reactivities of Serum Native IgG and Isolated Serum IgG Glycans with Fucose-Specific Lectins
Figure 1 Relative reactivities of serum native IgG (s-IgG), and isolated serum IgG (i–IgG) glycans with fucose-specific lectins: AAL - Aleuria aurantia lectin, LCA - Lens culinaris agglutinin, LTA - Lotus tetragonolobus agglutinin, UEA - Ulex europaeus agglutinin (A–D). For lectins specificity see Materials and methods section. Significant differences versus groups: AE, BNE. Median is indicated as a square. A two-tailed p-value of less than 0.05 was considered as significant (*p < 0.05; ***p < 0.001).
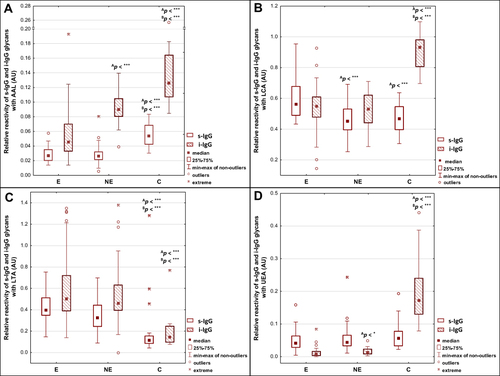
Table 2 The Correlations Between Relative Reactivities of IgG Glycans with Fucose-Specific Lectins
Figure 2 The correlations between relative reactivities of s-IgG and i–IgG glycans with fucose-specific lectins (A–D). For lectins’ specificity see Materials and methods section. A two-tailed p-value of less than 0.05 was considered as significant.
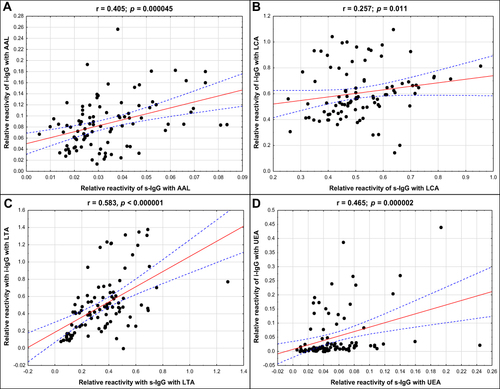
Table 3 Receiver Operating Characteristic Curve Analysis of Serum Native IgG and Isolated Serum IgG Relative Reactivities with Fucose-Specific Lectins
Figure 3 Receiver operating characteristic curve analysis of serum native IgG - s-IgG (s) and isolated serum IgG - i–IgG (i) relative reactivities with AAL (Aleuria aurantia lectin), LCA (Lens culinaris agglutinin), LTA (Lotus tetragonolobus agglutinin) and UEA (Ulex europaeus agglutinin) was done for women with endometriosis and healthy subjects (A–H). For lectins’ specificity see Materials and methods section.
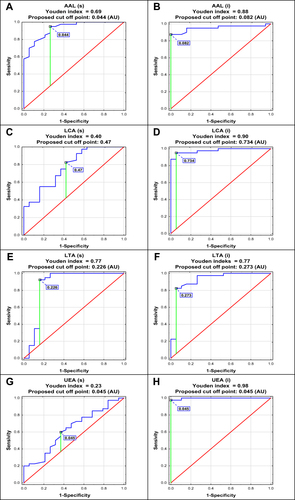
Table 4 Results of Cluster Analysis for Values of Serum Native IgG Relative Reactivities with AAL, LCA and LTA
Table 5 Results of Cluster Analysis for Values of Isolated Serum IgG Relative Reactivities with AAL, LCA and LTA
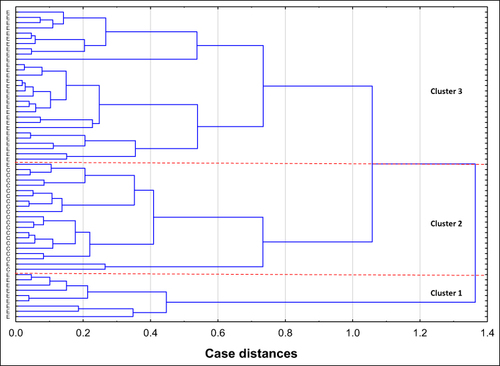
Figure 4 Dendrogram of cluster analysis for values of serum native IgG (s-IgG) relative reactivities with AAL (Aleuria aurantia lectin), LCA (Lens culinaris agglutinin) and LTA (Lotus tetragonolobus agglutinin). The cluster analysis was done only for parameters for which in receiver operating characteristic curve analysis the value of area under the curve was moderate or high (≥ 0.775), which significantly differentiates endometriosis patients from healthy women. Each serum sample is represented by a vector of three features: AAL, LCA and LTA relative reactivities with s-IgG.
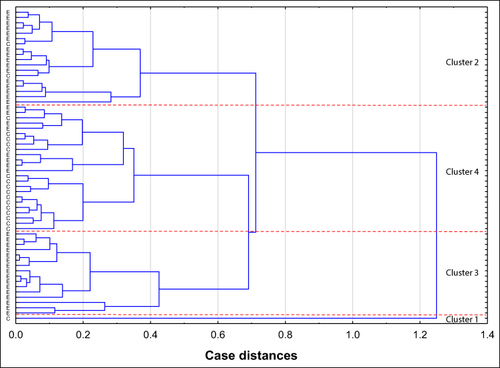
Figure 5 Dendrogram of cluster analysis for values of isolated serum IgG (i–IgG) relative reactivities with AAL (Aleuria aurantia lectin), LCA (Lens culinaris agglutinin) and LTA (Lotus tetragonolobus agglutinin). Cluster analysis was performed only for parameters for which in receiver operating characteristic curve analysis the value of area under the curve was higher than ≥ 0.775, and which significantly differentiated endometriosis patients from healthy women. Each serum i–IgG sample is represented by a vector of three features: AAL, LCA and LTA relative reactivity.