Figures & data
Figure 1 Representative flow cytometry graphs showing the cell surface marker analysis of peripheral blood and spleen lymphocyte populations (T, B, NK) and subsets of T lymphocytes (TCD3+CD4+CD8−, TCD3+CD4−CD8+).
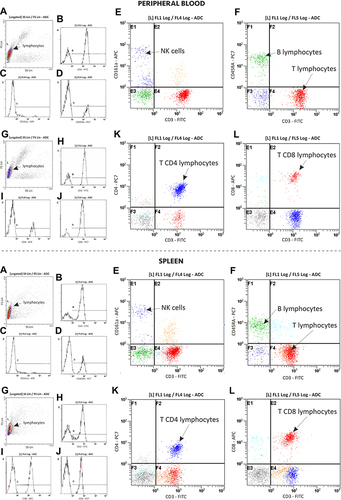
Table 1 The Total Number of White Blood Cells (WBC), Percentage and Total Numbers of Lymphocytes, Neutrophils, Eosinophils, Basophils and Monocytes, Relative Thymus and Spleen Weight in Young Rats Subjected to Dimethyl Fumarate (DMF) or Control Therapy (CTR) Initiated on Day 0 (0.4% DMF or Standard Rat Chow) and Intracerebroventricular Injection of Streptozotocin (STZ) or Vehicle (VEH) on Days 2 and 4
Table 2 The Total Number of White Blood Cells (WBC), Percentage and Total Numbers of Lymphocytes, Neutrophils, Eosinophils, Basophils and Monocytes, Relative Thymus and Spleen Weight in Aged Rats Subjected to Dimethyl Fumarate (DMF) or Control Therapy (CTR) Initiated on Day 0 (0.4% DMF or Standard Rat Chow) and Intracerebroventricular Injection of Streptozotocin (STZ) or Vehicle (VEH) on Days 2 and 4
Figure 2 The percentage and total number of T (CD3+), B (CD3−CD45RA+), NK (CD3−CD161a+) lymphocytes in the peripheral blood mononuclear cells (PBMC) analyzed by flow cytometric method in aged rats subjected to dimethyl fumarate (DMF) or control therapy (CTR) initiated on day 0 (0.4% DMF or standard rat chow) and intracerebroventricular injection of streptozotocin (STZ) or vehicle (VEH) on days 2 and 4.
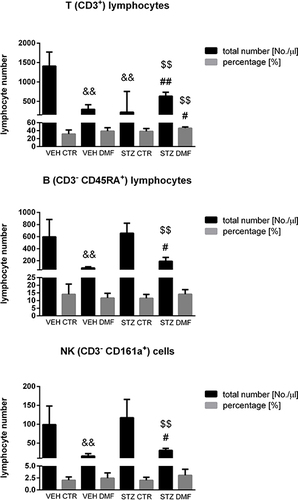
Figure 3 The percentage and total number of TCD4+ (CD3+CD4+CD8−) and TCD8+ (CD3+CD4−CD8+) lymphocytes in the peripheral blood mononuclear cells (PBMC) analyzed by flow cytometric method in aged rats subjected to dimethyl fumarate (DMF) or control therapy (CTR) initiated on day 0 (0.4% DMF or standard rat chow) and intracerebroventricular injection of streptozotocin (STZ) or vehicle (VEH) on days 2 and 4.
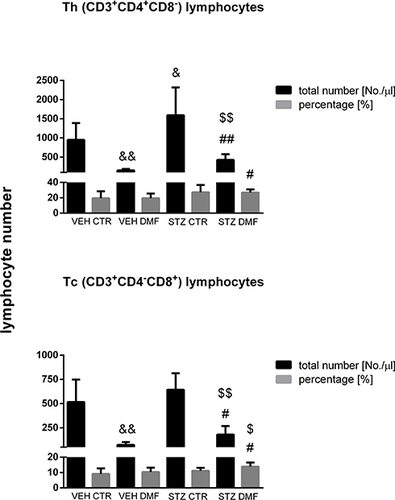
Table 3 The Complete Blood Count: Red Blood Cells (RBC), Platelets (PLT), Haemoglobin Concentration (HGB), Mean Haemoglobin Concentration in the Red Blood Cell (MCHC), Mean Mass of the Haemoglobin in the Red Blood Cell (MCH), Mean Corpuscular Volume (MCV), Hematocrit (HCT), Mean Platelet Volume (MPV), Red Cell Distribution Width (RDW) in Young (y) and Aged (a) Rats Subjected to Dimethyl Fumarate (DMF) or Control Therapy (CTR) Initiated on Day 0 (0.4% DMF or Standard Rat Chow) and Intracerebroventricular Injection of Streptozotocin (STZ) or Vehicle (VEH) on Days 2 and 4
Figure 4 Plasma concentration of interleukin 6 (IL-6) (A) and interleukin 10 (IL-10) (B) in young and aged rats subjected to dimethyl fumarate (DMF) or control therapy (CTR) initiated on day 0 (0.4% DMF or standard rat chow) and intracerebroventricular injection of streptozotocin (STZ) or vehicle (VEH) on days 2 and 4.
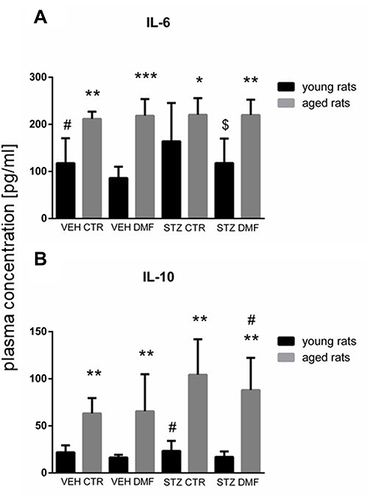
Figure 5 Concanavalin (Con) A-stimulated splenocyte mononuclear cell (SMC) production of interferon (IFN)-γ (A) and interleukin (IL)-10 (B) in young rats subjected to dimethyl fumarate (DMF) or control therapy (CTR) initiated on day 0 (0.4% DMF or standard rat chow) and intracerebroventricular injection of streptozotocin (STZ) or vehicle (VEH) on days 2 and 4.
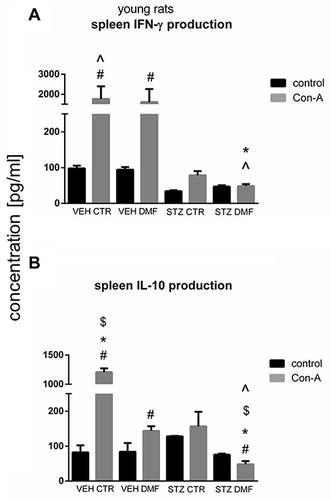
Figure 6 Concanavalin (Con) A-stimulated splenocyte mononuclear cell (SMC) production of interleukin (IL)-6 (A) and interleukin (IL)-10 (B) in aged rats subjected to dimethyl fumarate (DMF) or control therapy (CTR) initiated on day 0 (0.4% DMF or standard rat chow) and intracerebroventricular injection of streptozotocin (STZ) or vehicle (VEH) on days 2 and 4.
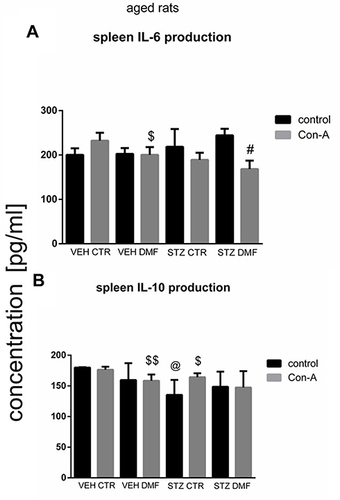
Figure 7 Concanavalin (Con) A-stimulated peripheral blood mononuclear cell (PBMC) production of interferon (IFN)-γ in young rats (A) and interleukin (IL)-10 in aged rats (B) subjected to dimethyl fumarate (DMF) or control therapy (CTR) initiated on day 0 (0.4% DMF or standard rat chow) and intracerebroventricular injection of streptozotocin (STZ) or vehicle (VEH) on days 2 and 4.
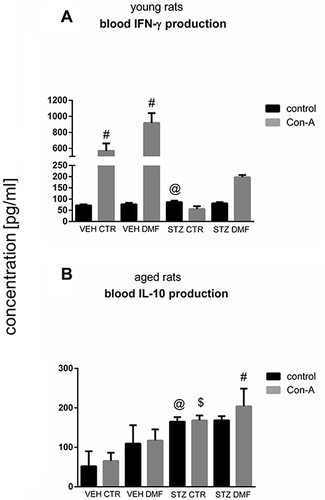
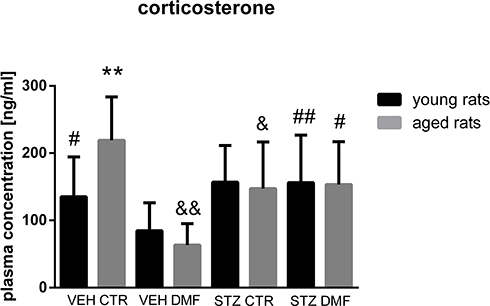
Figure 8 Plasma concentration of corticosterone in young and aged rats subjected to dimethyl fumarate (DMF) or control therapy (CTR) initiated on day 0 (0.4% DMF or standard rat chow) and intracerebroventricular injection of streptozotocin (STZ) or vehicle (VEH) on days 2 and 4.